

Increasing Irrigation Efficiency
Water Use and Management Research
Updated Crop Evapotranspiration (ET) & Salinity Management


Approach
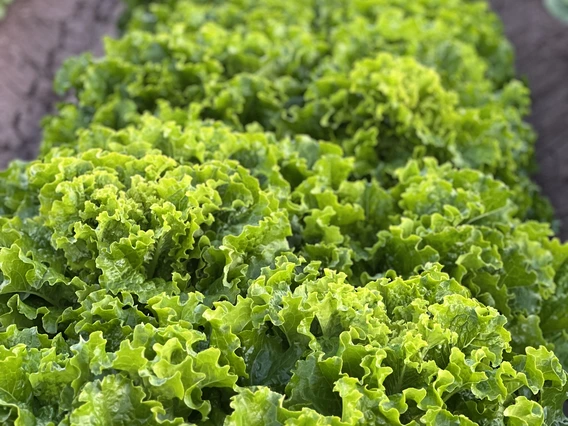
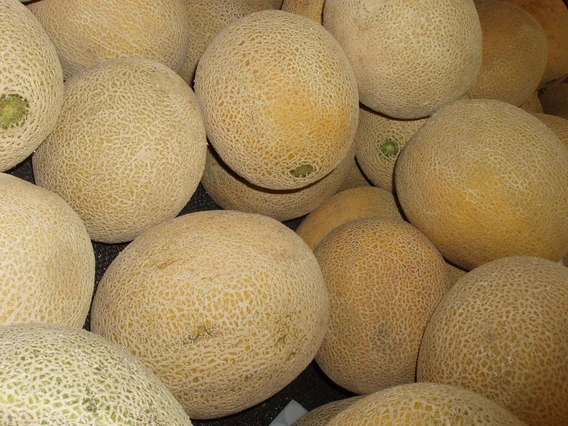
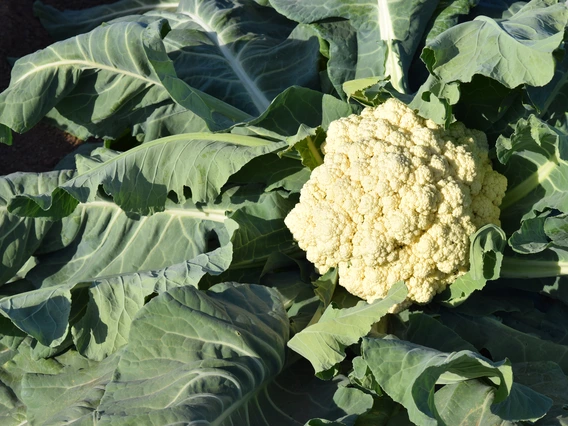
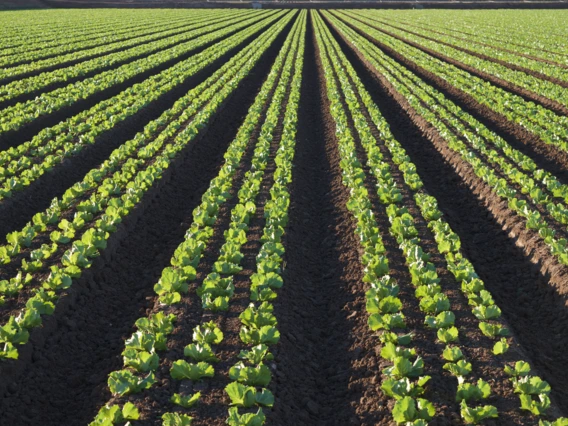
Studies were conducted in production field sites from 2016 through 2023. Over this period, field sites were established in all water management jurisdictions in Yuma County, including Yuma County Water Users Association (YCWUA), Yuma Irrigation District (YID), North Gila Irrigation and Drainage District (NGIDD), Wellton Mohawk Irrigation and Drainage District (WMIDD), Yuma Mesa Irrigation and Drainage District (YMIDD), Yuma Mesa Unit B (Unit B), as well as Bard Water District (BWD) in California. We also had a few sites outside these areas including the Island, Sidewinder, and central Arizona due to opportunities for accessing certain crops and requests by commodity funding partners. Crops evaluated included iceberg lettuce, romaine lettuce, Boston lettuce. leaf lettuce, broccoli, cauliflower, celery, spinach, spring mix, durum wheat, Sudan grass, alfalfa, cotton, cantaloupe, and watermelon. We also looked at summer fallow systems for two sites. Evaluations with leaf lettuce
Crop Evapotranspiration
The quantification of crop water budgets and water use efficiencies requires accurate methods of measuring crop evapotranspiration. The soil moisture depletion method used by Erie et al., (1982) would not be appropriate in the Yuma area due to the prevalence of fine textured soils and high-water tables within the flood plain districts. As part of this project, we initially evaluated alternative methodologies including eddy covariance (ECV) and large aperture scintillometer (LAS). For reasons of logistics, accuracy, and reliability, we largely moved forward using ECV methodology (Figure 2).
ECV obtains crop evapotranspiration (ETc) by measuring incoming and outgoing energy fluxes over the cropped landscape. The ECV measures four energy flux components: net radiation (Rn), ground heat flux (G), sensible heat flux (H), and latent heat flux (LE). Rn represents absorbed solar and infrared radiation, G is heat transported into the soil, H is turbulent heat above the crop due to air temperature gradients, and LE is latent heat energy due to ET. While ET can be estimated from just the LE component, accurate estimates require collecting all four components. ECV data values are reported in energy flux units (W/m2), with water-specific quantities also reported as depths over time (e.g., mm/day).
Each ECV system requires sensors, one or more data loggers, power supplies, and mechanical supports. Sensors measure air temperature, humidity, wind speed, wind direction, water vapor concentration, CO2 concentration, soil temperatures, soil moisture, and solar and infrared radiation, all at sample rates up to 20 Hz. Data loggers collect, analyze, and store analog and digital signals from the sensors. In some cases, they are connected to a cellphone modem for transmitting synopses of data and system health information to one of our home offices, but high- resolution data downloads require site visits to offload the data. Power supplies consist of 12V batteries, voltage regulators, grounding rods, and solar panels. The mechanical supports include tripods, masts, lightning rods, anchors, and guy wires to ensure the sensors, loggers, and power supplies remain accurately aligned in all weather conditions.
In cropped fields, the systems were installed at planting and removed immediately before harvest. In fallow fields, the systems were installed before fallow initiation and removed at fallow termination. A field crew maintained the systems continuously and was available to move the systems out of the way for field operations such as cultivation, fertilization, and pesticide application.
Water Inputs
Irrigation water amounts applied to all fields were measured. For sprinkler irrigation systems we used in-line meters and both automatic and manual rain gauges. The manual gauges were used to collect water for salinity analysis because the automatic gauges do not retain the water. For surface irrigation we used meters at the canal gates where they were available. These were always available for YID and some of the BWD sites. Where these were not available (most other sites), we measured water velocity, water depth, and irrigation time during each irrigation event and, based on ditch geometry, calculated water delivered. For drip irrigation we used meters where available but where not available, irrigation depths were estimated using irrigation time coupled with tape output ratings.
Weather data
UA AZMET stations and on-site ECV observations provided the needed weather data. Data streams at 30-minute intervals, including ETo, and heat units (HU) were taken from the AZMET weather network. In most cases we used the AZMET station nearest to each field study location. Some water managers, notably the USBR (LCRAS), use weather data and crop coefficients to estimate crop water use following FAO-56 protocols (Allen et al, 1998). Crop coefficients relate ETo calculated from weather data to ETc by growth stage. Our direct measurement of ETc from ECV stations provided us data to update crop coefficients. Resulting Kc values fulfill our objectives for the USBR funding contribution and assist commodity contributors interested in the development of an irrigation and salinity management APP.
Satellite Imagery
Satellite imagery was used to delineate growth periods, along with HU, for Kc-based irrigation scheduling, forecasting, and accounting. We used data from Landsat 8 (https://www.nasa.gov/mission_pages/landsat/launch/index.html) and Sentinel 2a/2b (https://www.esa.int/Our_Activities/Observing_the_Earth/Copernicus/Senti…). These data were initially collected to address our USBR deliverables but will ultimately have utility in scheduling as the DesertAgWISE APP capabilities are expanded.
Salinity Monitoring
As with ETc measurements we initially deployed redundant methodologies. At the point scale, sensors and data loggers measured soil moisture and bulk conductance. On a larger scale we used electromagnetic conductance (EM 38) surveys. Both were validated with soil sampling. In the first year we found that EM 38 methods augmented with soil sampling was more than adequate for our needs and we moved forward using this approach.
Fields were surveyed using a Dual-dipole EM38 meter (Geonics Limited, Mississauga, Ontario, Canada) mounted on a mobilized assessment platform with an integrated sub-meter accuracy global positioning system (GPS), with all survey and GPS position data logged into an on-board portable computer. In baseline surveys, EM38 signal data were collected once every two seconds within transects spaced 10 to 20 meters apart, typically generating from 1000 to 5000 survey positions per field. Transect spacing and the total number of survey positions depended on the field size. These data were analyzed using the ESAP software package (https://www.ars.usda.gov/pacific-west-area/riverside-ca/us-salinity-lab…) and the spatial response surface sampling algorithm in the ESAP-RSSD program. At each sampling location, a single 1.2 m soil core was extracted using automated soil auguring equipment and split into four depth-specific 30 cm samples. The soil samples collected from each core were bagged, labeled, and subsequently used for the chemical and physical analyses. Subsets of all soil samples were oven-dried to determine soil moisture content. The remainder of the soil samples were air-dried prior to laboratory analysis. After obtaining saturated paste extracts from all soil samples, we determined electrical conductivity (ECe), and cation/anion quantities for calcium (Ca+2), magnesium, (Mg+2), sodium (Na+), potassium (K+), chloride (Cl-), sulfate (SO4-2), nitrate (NO-3) and bicarbonate (HCO-) by ion chromatography. The chloride analyses were used as another indicator of leaching as it is more conservative, and less likely to be involved in precipitation/dissolution reaction in carbonate soil systems. The Ca+2, Mg+2, and Na+, and HCO- were used the calculate an adjusted sodium adsorption ration (SAR). The cation and anion data were also used with a speciation program (MINTEQ 3A2; https://www.epa.gov/sites/default/files/documents/USERMANU.PDF) to gain a preliminary understanding of the chemistry of soil reactions and potential for salt precipitation with respect to these salinity ions.