
Increasing Irrigation Efficiency
Water Use and Management Research
Updated Crop Evapotranspiration (ET) & Salinity Management
Wheat (Durum)
| Stage | GDD (Co) | GDD (F) | NDVI | Kc |
|---|---|---|---|---|
| INI | 12 | 53 | 0.16 | 0.52 |
| INI/DEV | 315 | 599 | 0.16 | 0.52 |
| DEV/MID | 670 | 1239 | 0.68 | 1.34 |
| MID/END | 1880 | 3416 | 0.46 | 1.34 |
| END | 2508 | 4547 | 0.2 | 0.67 |
GDD based on minimum and maximum thresholds of xxC (xxF) and xxc (xxF), respectively.
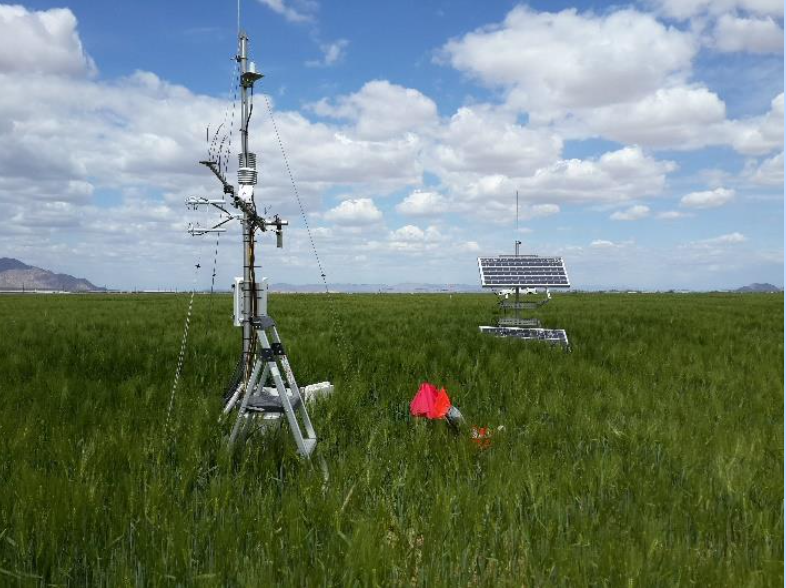 | 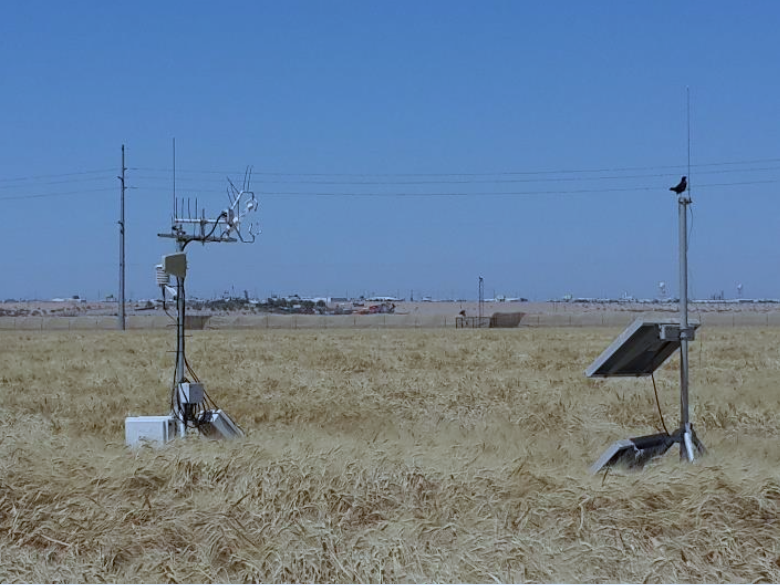 | |
Figure 1 Eddy covariance systems used to measure ETc in wheat during heading and senescence stages. | ||
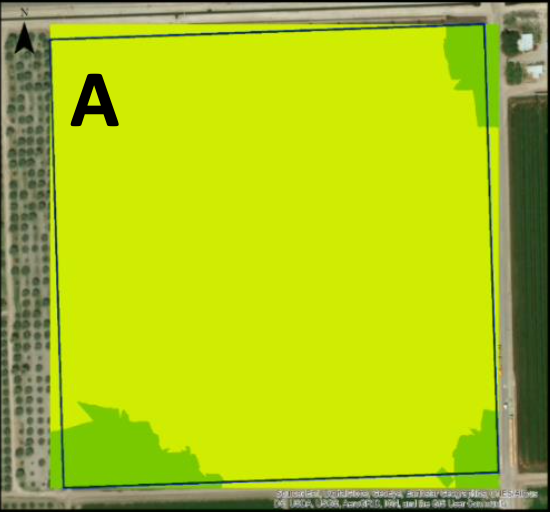 | 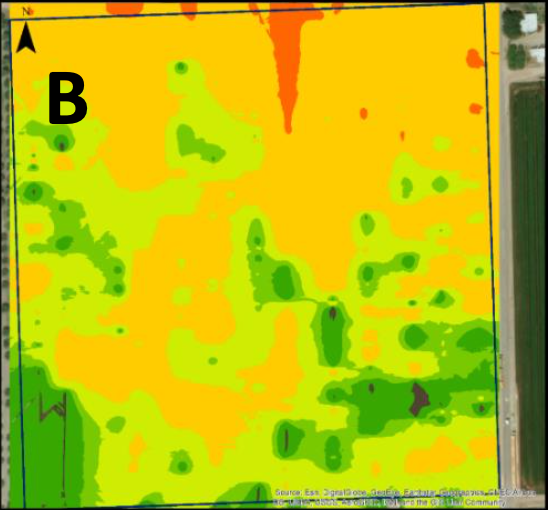 | 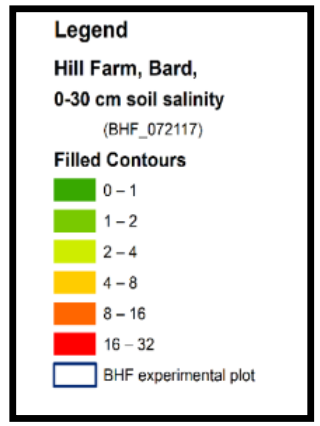 |
Figure 2 Measured field-wide changes in root zone salinity before (A, December 2016) and after (B, July 2017) wheat in the Bard Water District. At the high water application efficiencies for wheat in the Yuma area, the required leaching is not obtained during the cropping season. |

