Increasing Irrigation Efficiency
Water Use and Management Research
Updated Crop Evapotranspiration (ET) & Salinity Management
Broccoli
Table 1. Broccoli heat units, NDVI, and Kc values classified by FAO-56 growth stages.
| Stage | GDD (C-Day) | GDD (F-Day) | NDVI | Kc |
|---|---|---|---|---|
| INI | 0.090 | 0.519 | ||
| INI/DEV | 456.2 | 853.2 | 0.144 | |
| DEV/MID | 1004.5 | 1840.1 | 0.800 | 0.799 |
| MID/END | 1406.7 | 2564.1 | 0.800 | |
| END | 1543.4 | 2810.1 | 0.472 |
GDD is based on minimum and maximum thresholds of 4.4 C (39.9 F) and 28 C (82.4 F), respectively.

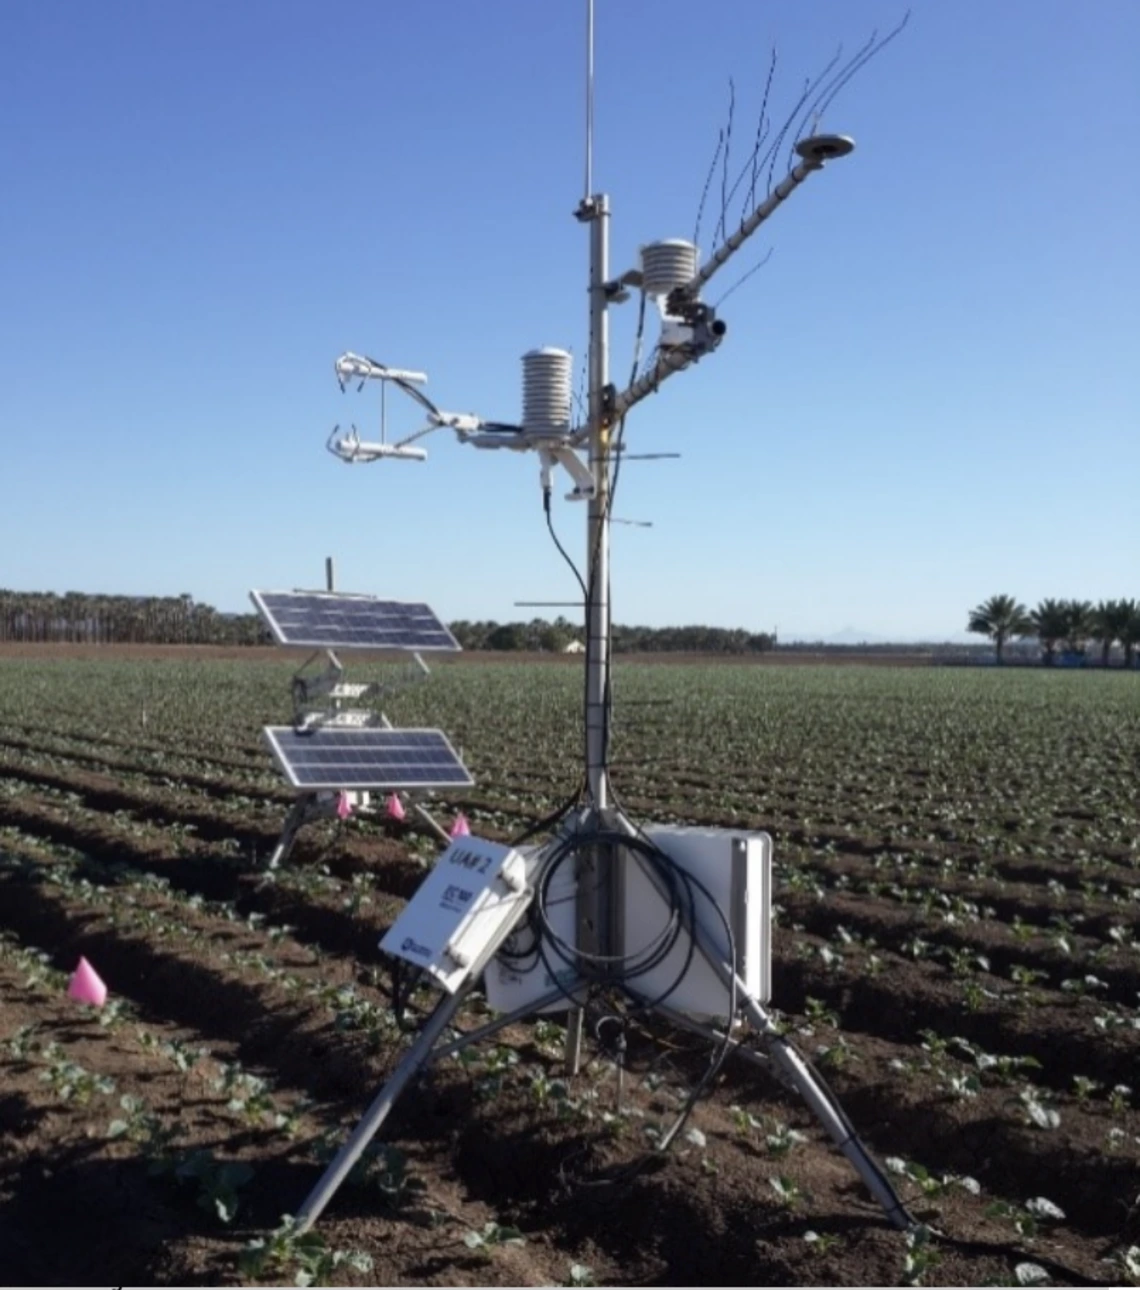
Figure 1
Eddy covariance in a broccoli field in Bard Water District. used to measure ETc in baby spinach production fields.

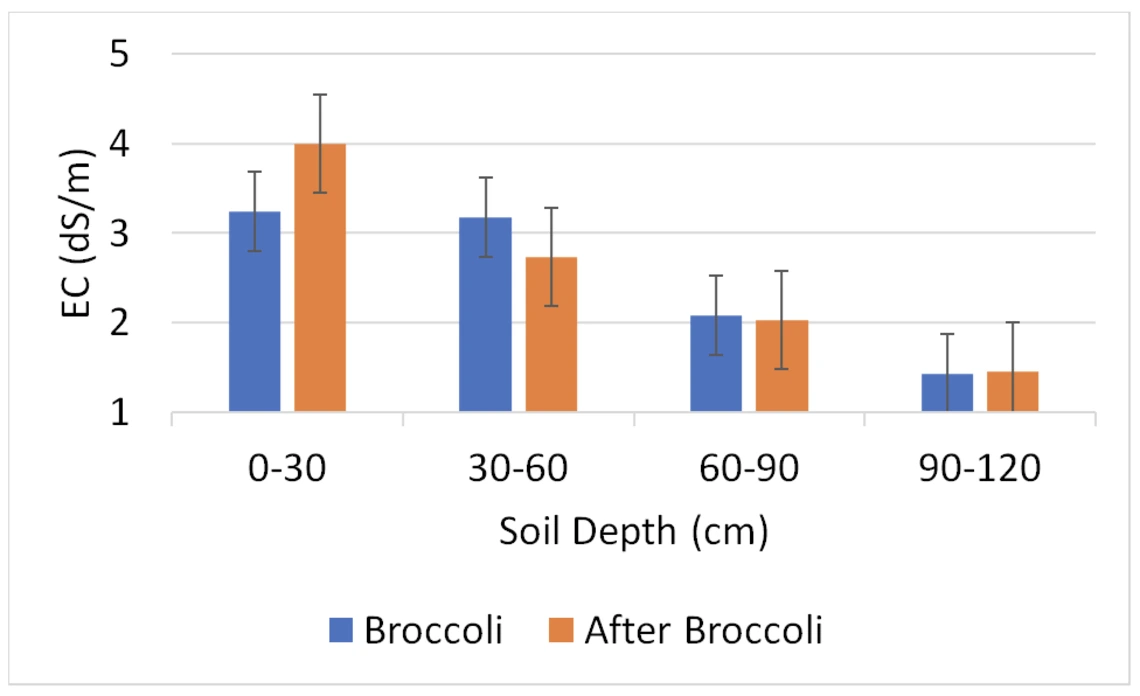
Figure 2
Salinity increases in surface of broccoli field. used to measure ETc in baby spinach production fields.


