
Increasing Irrigation Efficiency
Water Use and Management Research
Updated Crop Evapotranspiration (ET) & Salinity Management
Cauliflower
Arizona ranks second in the United States in Cauliflower production. Approximately 7,000 acres are produced in the lower Colorado River region near Yuma and has a value of approximately 113 million dollars.
Most cauliflower is produced from transplants and stands are established by sprinklers or furrow water during planting. After stand establishment all subsequent irrigations are by furrow irrigation. Using eddy covariance (Figure 1), seasonal ETc ranges from 368 to 524 mm (14.5 to 20.6 acre-inches). Like the other cool season crops, days from first irrigation to harvest vary. This means that growth and water use are more accurately tracked using growing degree days (GDD) and satellite imagery. The calculated crop coefficients (Kc) by growing period are shown below (Table 1).
Because cauliflower, like other cool season vegetable crops, receives efficient irrigation applications, there is a potential for salt accumulation in season and during the summer rotational crop (Figure 2). The required leaching is typically achieved in a pre-irrigation off-season in the late summer months.
Table 1. Cauliflower heat units, NDVI, and Kc values classified by FAO-56 growth stages.
| Stage | GDD (C-Day) | GDD (F-Day) | NDVI | Kc |
|---|---|---|---|---|
| INI | 0.103 | 0.59 | ||
| INI/DEV | 311.9 | 593.4 | 0.154 | |
| DEV/MID | 1013.8 | 1856.8 | 0.857 | 0.91 |
| MID/END | 1540.3 | 2804.5 | 0.857 | |
| END | 1718.8 | 3125.8 | 0.505 |
GDD based on minimum and maximum thresholds of 2.8 C (37 F) and 30 C (86 F), respectively.
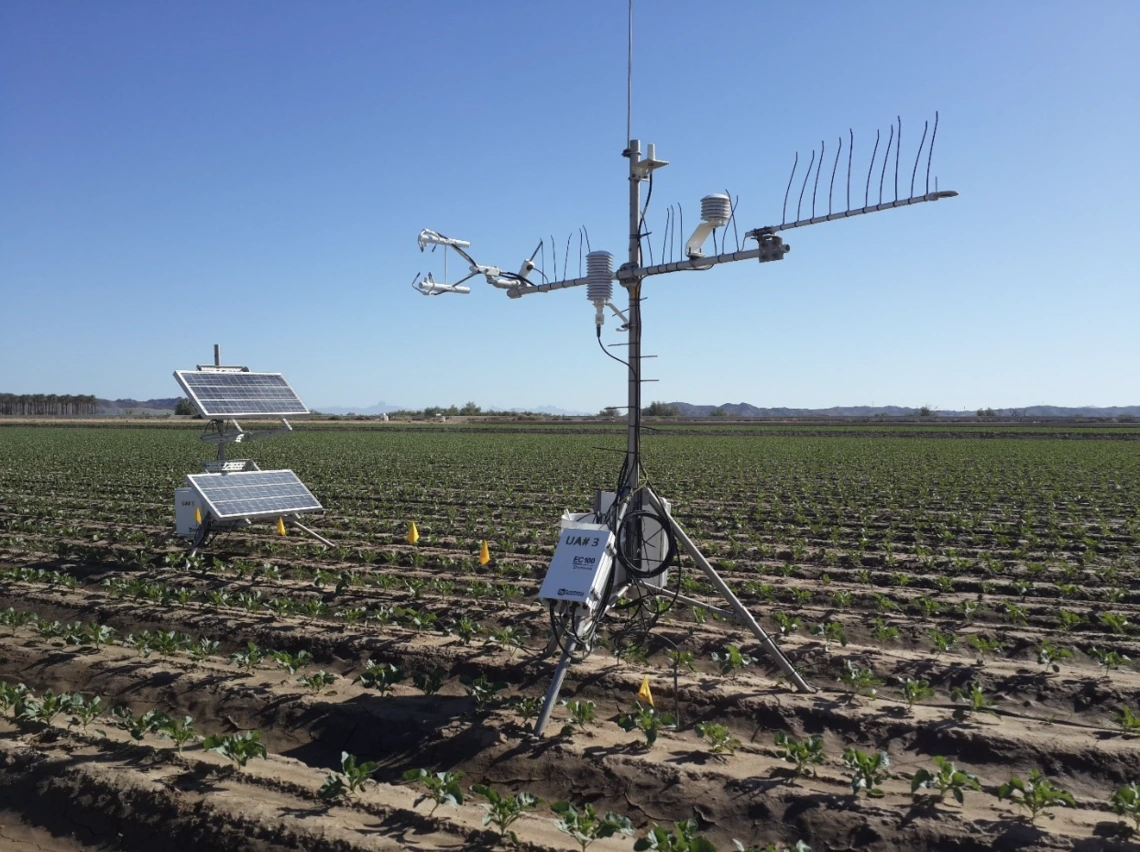
Figure 1
Eddy covariance system in a cauliflower production field in the lower Colorado River region.
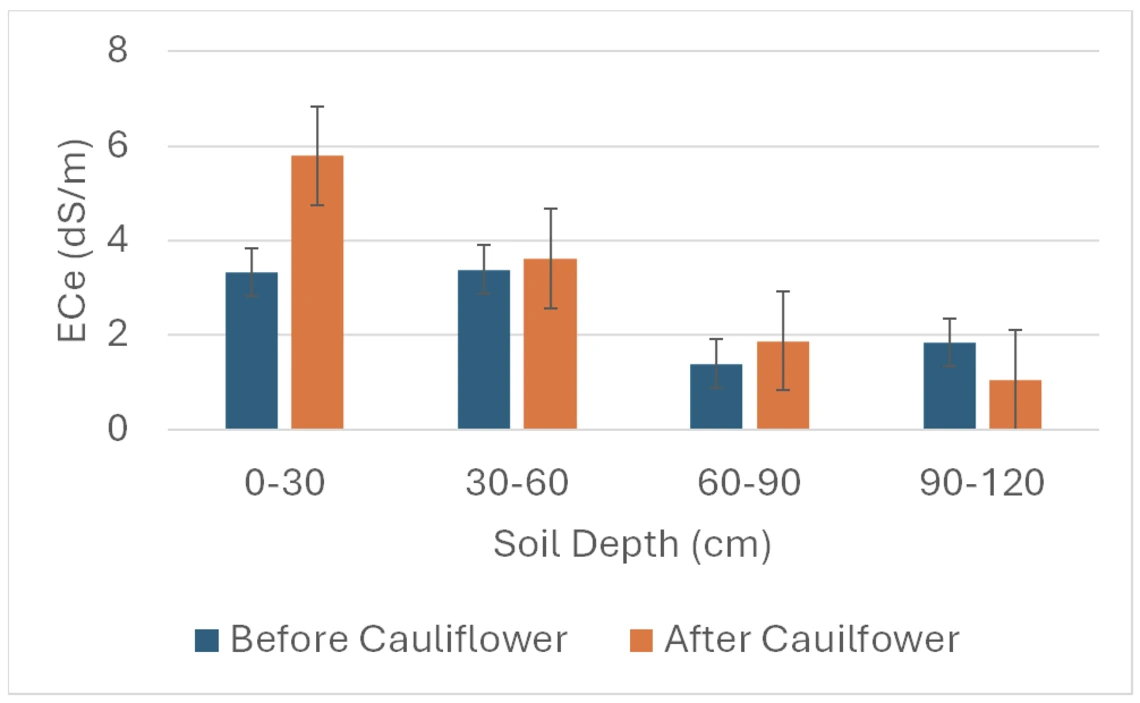
Figure 2
Salt accumulation in surface soil during cauliflower production.