Improve Plant Nutrition
Fertilizer Guidelines for Vegetable Crops in Arizona
Special Sections (4)
Variable Rate Fertilizer Practices (4.7)
Fertilizer guidelines presented in this webpage are based on soil testing of composite soil samples collected from a production unit, which may range from 10 acres for a crop of spinach to 40 acres for most other crops. In other words, the results of soil fertility tests conducted on the composite soil samples are used to estimate the effective average field-wide fertilizer requirements of a production unit. Typical soil fertility variations within production fields in the Lower Colorado River Region, and the challenges of collecting representative composite soil samples from such fields, are covered in Section 4.1. An alternative fertilizer management practice to the conventional approach, which is largely under research and development and is commonly referred to as variable rate (VR) fertilization, involves applying fertilizers in a manner that accounts for the spatial variations in soil fertility levels within a production unit. Although VR fertilization is currently not practiced in the Lower Colorado River Region, it represents a promising prospect for enhancing nitrogen (N) and phosphorus (P) fertilizer use efficiencies in the region. Specifically, the pre-plant P and sidedress N practices common in the region may readily lend themselves to VR fertilizer application technologies.
Generally, VR fertilizer management recommendations are developed based on a fertilizer application prescription map of the production field. A rigorous approach for defining a VR fertilizer application prescription map involves geostatistical analysis of high-resolution soil fertility test data collected across the production field. However, this approach is not economically viable, primarily because the marginal value of the fertilizer savings accruing from its implementation would rarely cover the cost of the additional soil sampling and analysis it entails compared to conventional practices.
An alternative and more practical approach compared to that described above involves subdividing the production field into discrete VR fertilizer application management zones based on a survey of some readily determinable soil properties known to be correlated to plant nutrient availability. The crop nutrient requirement for a management zone can then be characterized based on soil fertility tests conducted on composite soil samples collected from each zone. As noted in Section 4.1, the alluvial soils typically used for vegetable production in the Lower Colorado River Region show considerable textural variation within a production field. Furthermore, soil texture can affect N leaching and chemical reactions that tie up P to soils, which implies that measured spatial variations in soil texture can be used as a convenient indicator of factors affecting potential variation of soil fertility within a production field. One option for defining soil textural variations is to use the digital soil survey maps of the Natural Resources Conservation Service (NRCS) (112). While the NRCS soil maps have the advantage of being readily available, they lack the spatial resolution required to define variable fertilizer application management zones within a production field. Thus, high resolution soil texture maps generated from data collected through onsite conductance surveys (e.g., Figure 4-7-1) are often used in defining management zones. Management zones delineated in this manner are then sampled separately, and soil fertility test of composite samples from each zone are used to generate zone-specific N fertilizer recommendations (Figure 4-7-2). For example, Figure 4-7-3 depicts a N fertilizer prescription map developed based on nitrate-N testing of composite soil samples obtained within each management zone of the field mapped in Figure 4-7-2.
The current author and cooperators have conducted preliminary studies evaluating the VR application of pre-plant P and sidedress of N-fertilizers for lettuce, broccoli, cauliflower, and celery crops. Results of the studies showed that crop yield from the VR application method matched those obtained under existing conventional practices, but with a 10-15% savings in P fertilizer and 20-30% savings in N fertilizer. However, the marginal economic value of the savings in required P fertilizer did not always offset the additional cost of surveys, sampling, and analysis that VR management requires compared to conventional practices. In contrast, the results show a more favorable outcome for VR management of N fertilizers relative to conventional practices.
As noted earlier, VR fertilizer management is under research and development. New and emerging sensor technologies promise improved accuracy and logistical feasibility for future applications of VR fertilizer management. For instance, exploratory investigation by the current author and cooperators of spectral sensors (Figures 4-7-4 and 4-7-5) suggests trends associated with plant vigor but were highly dependent on the size of the crops at the time of sidedressing N fertilizer. Reflectance measurements alone were not consistent as a basis for driving VR fertilizer decisions, but it leaves ample room for integration of other sources of information to increase accuracy. Future work in this area should focus on continued emerging spectral technologies and integration of data fusion tools for exploitation of multiple data streams in fertilizer rate decisions.
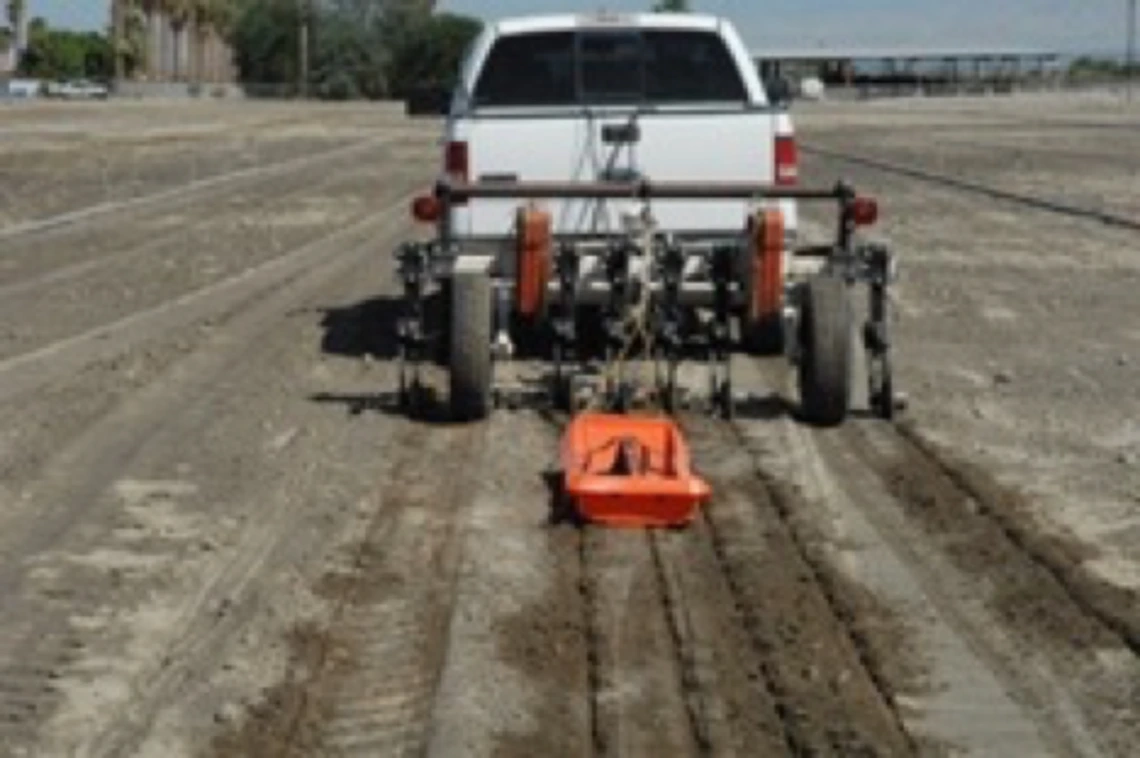
Figure 4-7-1
Conductance survey in Yuma with a Veris and EM38 sensor Assembly. Note: both the Veris and EM38 sensors were used here in the context of a comparative field evaluation of these systems. However, commercial applications typically deploy the Veris assembly.
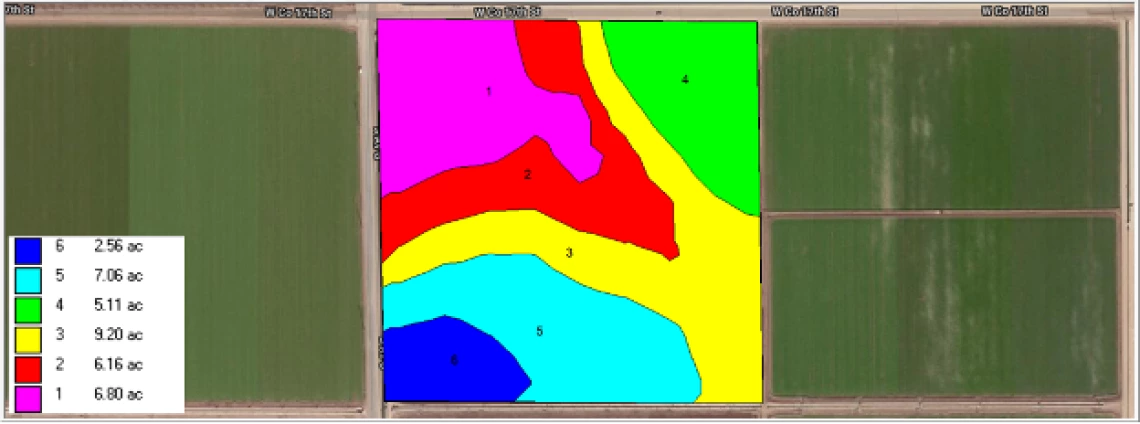
Figure 4-7-2
Management zones for a lettuce field in south Yuma Valley derived from soil conductance survey.
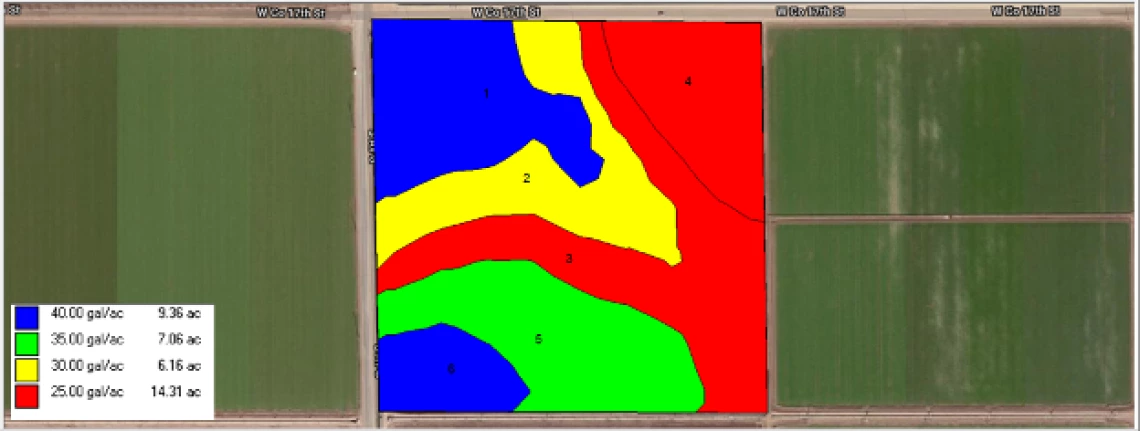
Figure 4-7-3
Map showing variable rate soil nitrate-N application recommendations based on composite soil samples collected from each N management zone. Note: the N fertilizer considered in this study is urea ammonium nitrate (UAN-32).
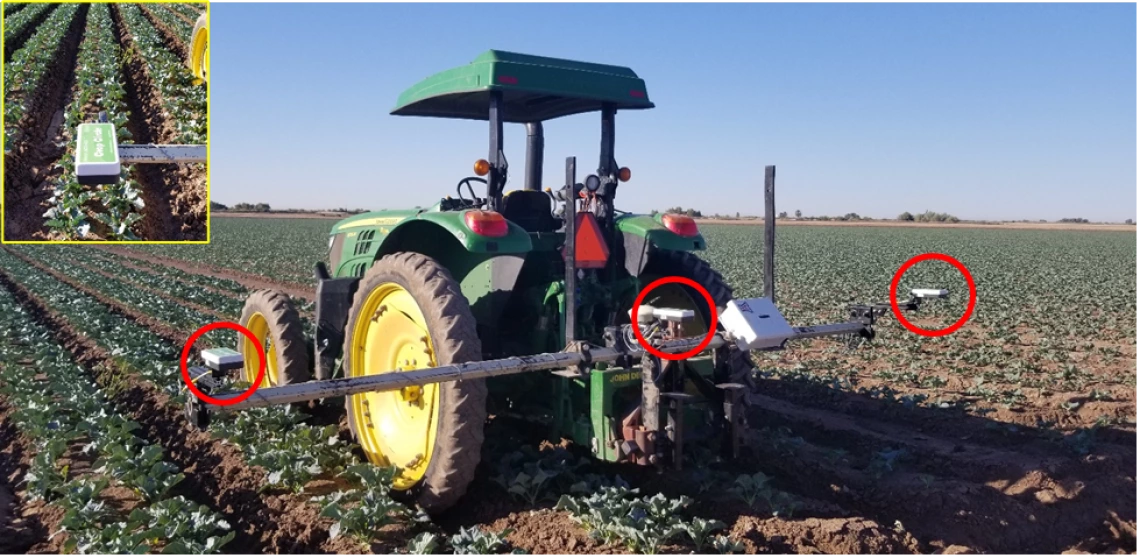
Figure 4-7-4
Proximal spectral electronic sensing to characterize plant vigor and possibly modify sidedress N application.
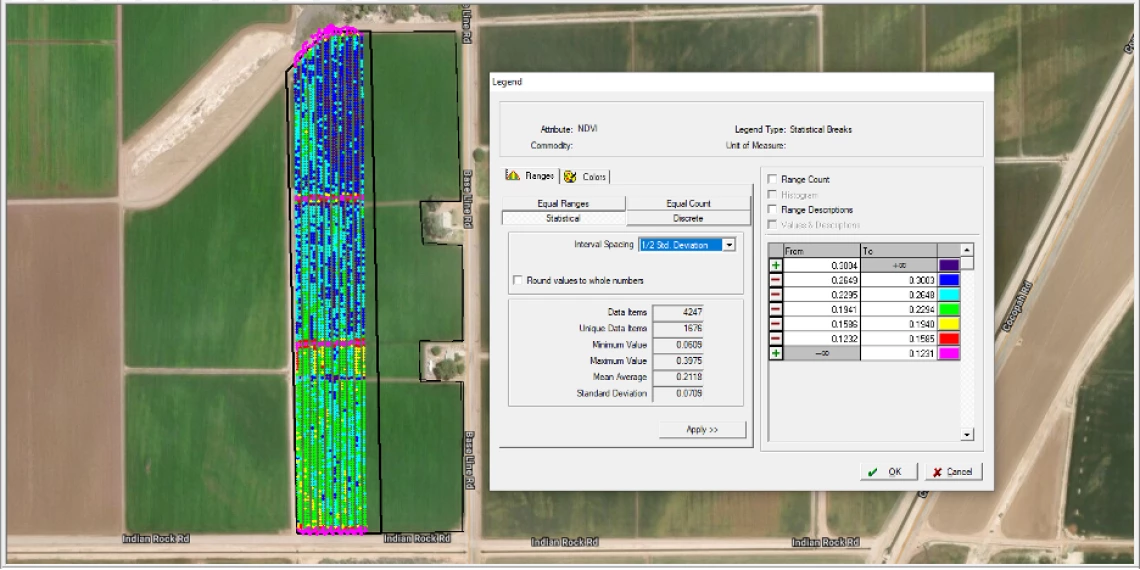
Figure 4-7-5
Spatial distribution of NDVI derived from real time spectral imagery can potentially be used in developing N fertilizer application rate adjustments.

