Improve Plant Nutrition
Fertilizer Guidelines for Vegetable Crops in Arizona
Nutrients Required (2)
Phosphorus (2.2)
Cool season vegetable crops produced in the arid southwestern United States typically receive large annual applications of phosphorus (P) fertilizer for optimal yield and quality. P fertilizer added to the calcareous agricultural soils of the region is rapidly converted to forms less available to plants through sorption and precipitation reactions. The removal of inorganic P from the soil solute through sorption is related to the presence of CaCO3 (24, 25, 26, 27) and is limited to conditions where the initial soil solution concentrations of P is relatively low. At higher soil solution P levels, precipitation becomes a more important mechanism of P removal from the soil solution (24). In calcareous soils, the acidic fertilizer solution would readily dissolve calcium (Ca), a process generally followed by reactions that precipitate most of the P fertilizer, initially as sparingly soluble phosphates (i.e. dicalcium phosphate dihydrate and dicalcium phosphate). These compounds would then be converted to more stable precipitates (consisting of octacalcium phosphate, tricalcium phosphate, or one of the apatites) at a slower rate (28, 29). These reactions are often referred to as reversion processes (30), because the reaction thermodynamics favors processes where the soil applied P fertilizer compounds convert into mineral species similar to the phosphate forms found in nature, forms typically not available to plants.
Soil P transformations are complex and poorly defined. P availability is often characterized in general terms as solution P, readily available or labile P, and non-labile P (31). The labile fraction might include easily mineralizable organic P, low-energy sorbed P, and relatively soluble mineral P. The non-labile fraction might include resistant organic P, high-energy sorbed P, and relatively insoluble P minerals. As plants absorb P from the soil solution, it is rapidly replenished from the labile fraction, which in turn is replenished by the non-labile fraction, often at rates insufficient to meet plant demand. The sodium bicarbonate soil test (Olsen P test) used in the western United States aims to characterize the soil solution and labile P fraction and serves as a basis for most P fertilizer recommendations developed for the region (32).
In contrast to the soil nitrate-N test, which approximates a direct quantitative measure of plant available nitrogen (N) in the soil, the Olsen P test is a correlated index of P availability. Crop specific recommendations for P fertilizer applications were developed based on field studies, such as those shown in Figure 2-2-1 for lettuce. Lettuce requires more P than other vegetable crops produced in the Yuma area and shows response to P fertilization up to a relatively high soil test level of 35 mg/kg Olsen P. Baby spinach, on the other hand, generally shows a lower relative response and does not show response above a threshold soil concentration of 25 mg/kg Olsen P (Figure 2-2-2). A survey conducted of pre-plant soil samples shows that most soils used for vegetable production have Olsen P soil test levels below 20 ppm, and P fertilization continues to be required for most cool season vegetables (Figure 2-2-3). This region does not have the high background soil test P levels observed in the Central Coast vegetable production region of California (33). It may be because the Yuma region has not been utilized for intensive vegetable production as long as the Central coast of California, or perhaps because the high background carbonates in the soil and irrigation water in the Yuma system continues to tie-up P in unavailable forms.
All P fertilizers should be applied according to a pre-plant soil test. Unlike crop available N, which largely stays in the soil solution and is readily available for plant uptake, the crop availability of P is mainly limited by diffusion between the reactive components in the soil and the soil solution. As a result, it is nearly impossible to correct P deficiencies relating to vegetable crops through in-season applications (34). Thus, a sound P fertilizer management strategy needs to maximize crop available quantities of P within the root zone through the cropping season.
P fertilizer recommendations are typically based on pre-plant broadcast applications. However, studies conducted by the author outside the Yuma area showed that P application efficiency can be increased by pre-plant band or strip applications (35, 36). An additional study conducted by the author validated the applicability of the results of those studies to vegetable crops produced in Yuma area (Figure 2-2-4). Based on results of these studies, a recommendation was made to reduce application of P fertilizer by 35% when band applied or by 25% when applied in strips into the beds (Figure 2-2-5). While most vegetable growers in the region use MAP (11-52-0) as the P source, there is occasional interest in alternative P sources, mainly for logistical reasons. However, results of studies conducted by the author showed that alternative P sources largely underperformed relative to that of MAP (Figures 2-2-6, 2-2-7, and 2-2-8). Thus, due diligence is recommended when changing from MAP to alternative P sources. For instance, evaluation of the performance of the alternative P source on a limited acreage before usage in a full-scale production unit can be helpful in making a judicious decision.
Phosphate recommendations are specific for each crop and are presented in Section 3.
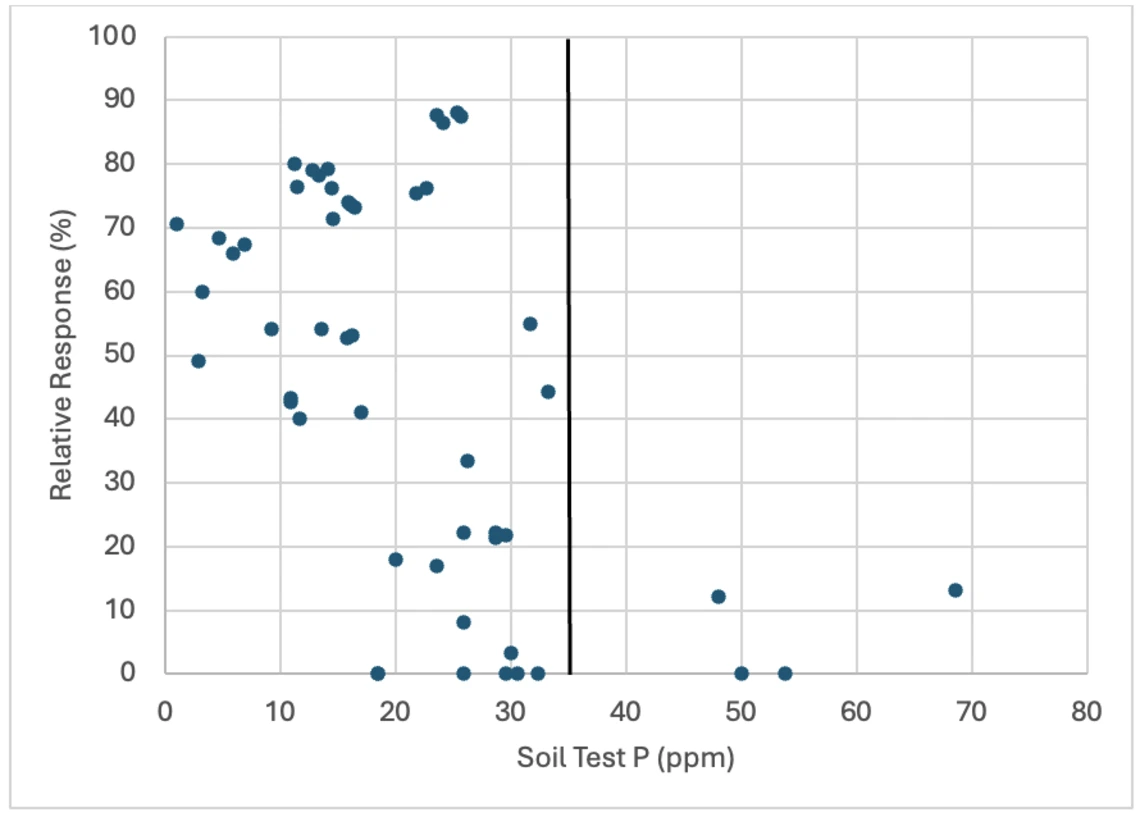
Figure 2-2-1
Relative response of lettuce to Olsen soil test P. These data were collected from field fertilzer experiments conducted from 2009 -2019.
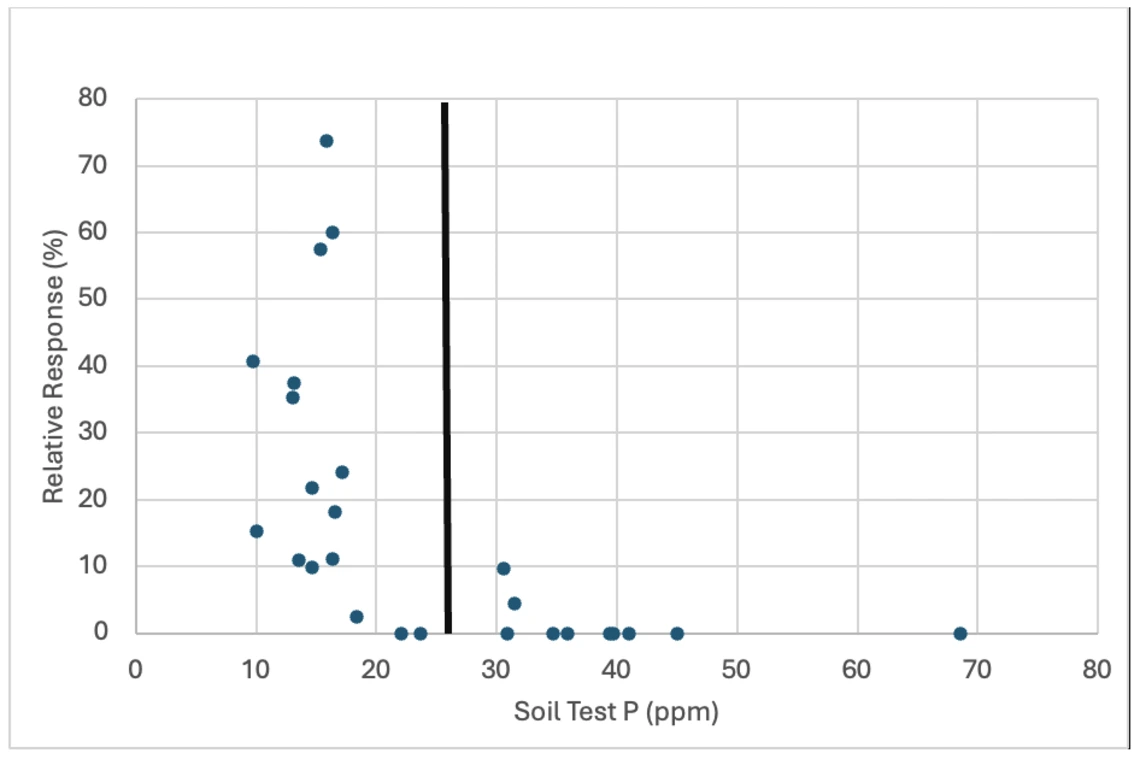
Figure 2-2-2
Relative response of baby spinach to Olsen soil test P. This data was collected from multiple field P fertilizer experiments conducted in Arizona from 2014 -2019.
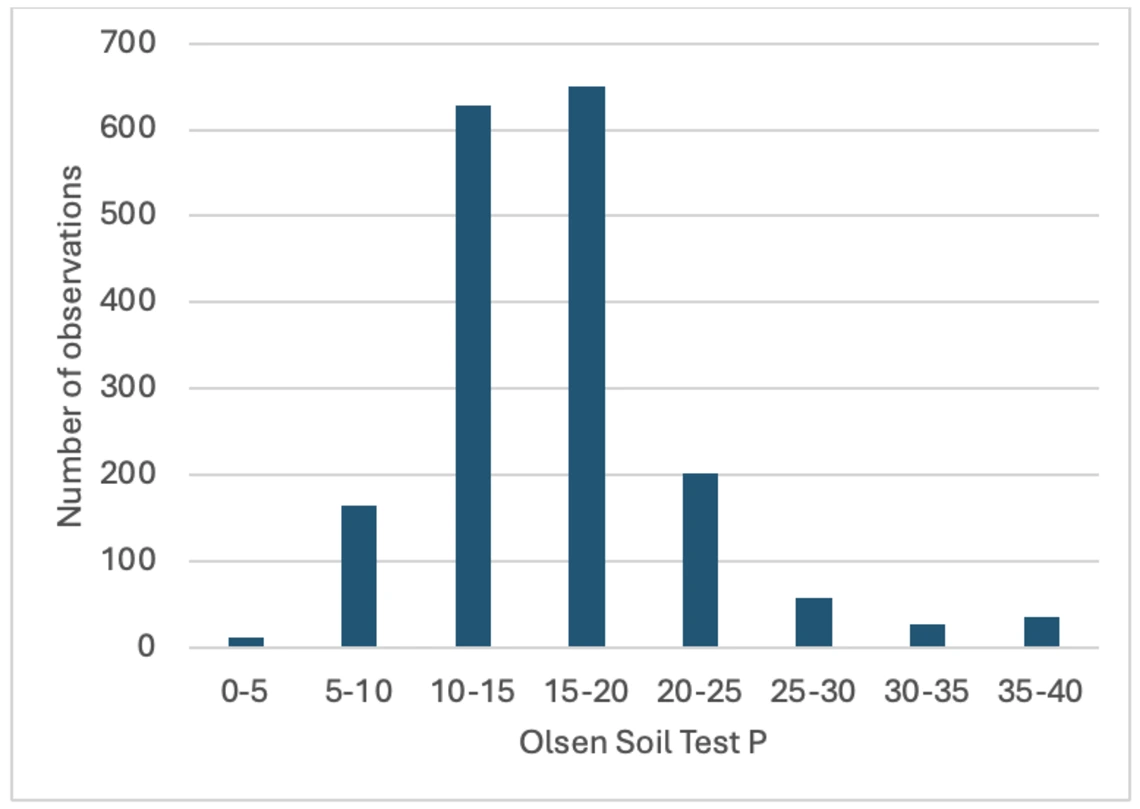
Figure 2-2-3
Pre-plant soil test Olsen P levels from 1,775 samples collected from 2021-2025 across the Yuma vegetable production region including the Bard Water District, Yuma County Water Users Association, Yuma Irrigation District, North Gila Irrigation and Drainage District, and the Wellton-Mohawk Irrigation and Drainage District. Adapted from (14).
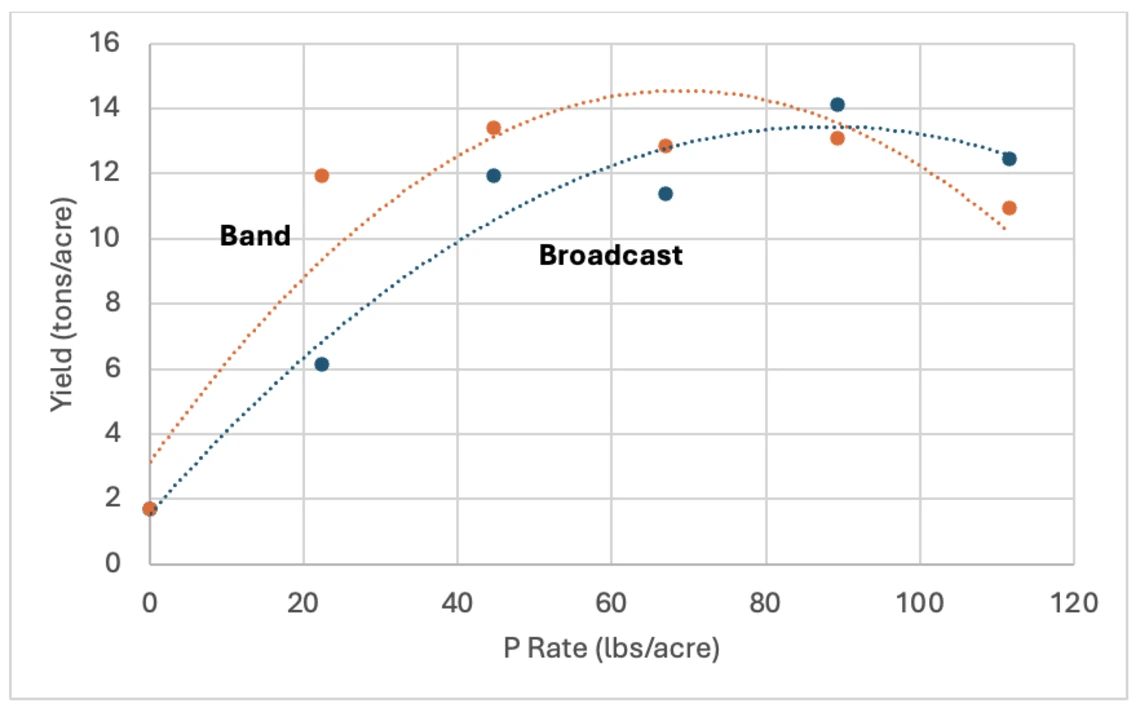
Figure 2-2-4
Response of lettuce to broadcast or banded MAP in Yuma from 2009-2010. Other field studies in Yuma produced similar results.
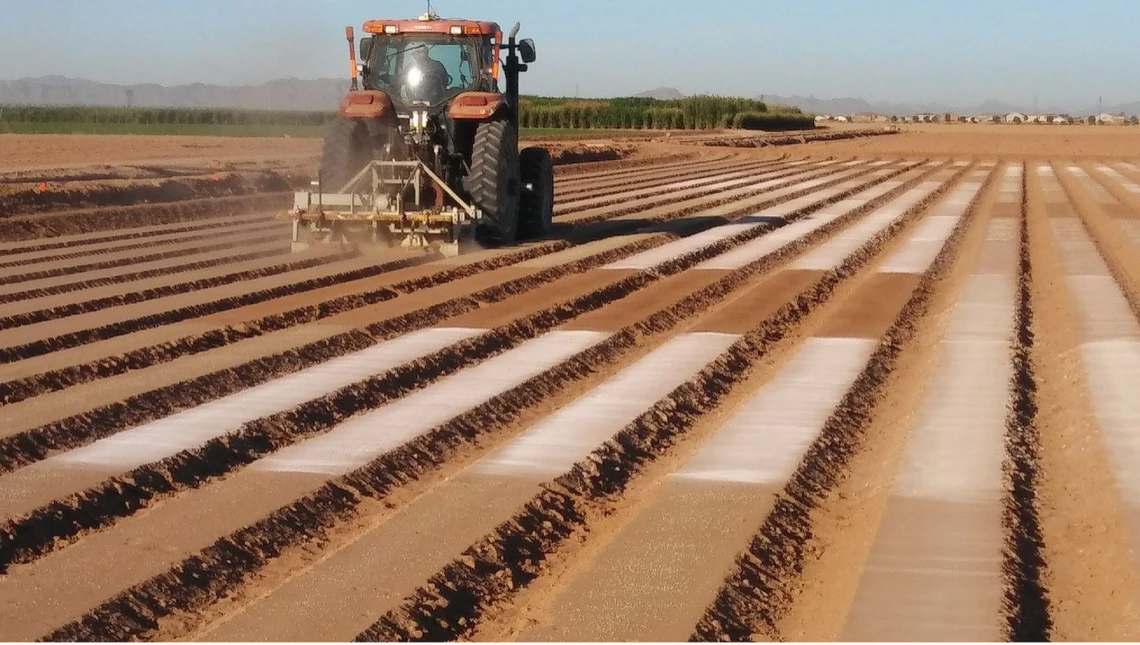
Figure 2-2-5
Band applied fertilizer is applied with a knife in a narrow zone below or to the side of where seed will be planted. Strip applied, as shown at left for an experiment at a university farm, is applied to the bed and power mulched into the bed.
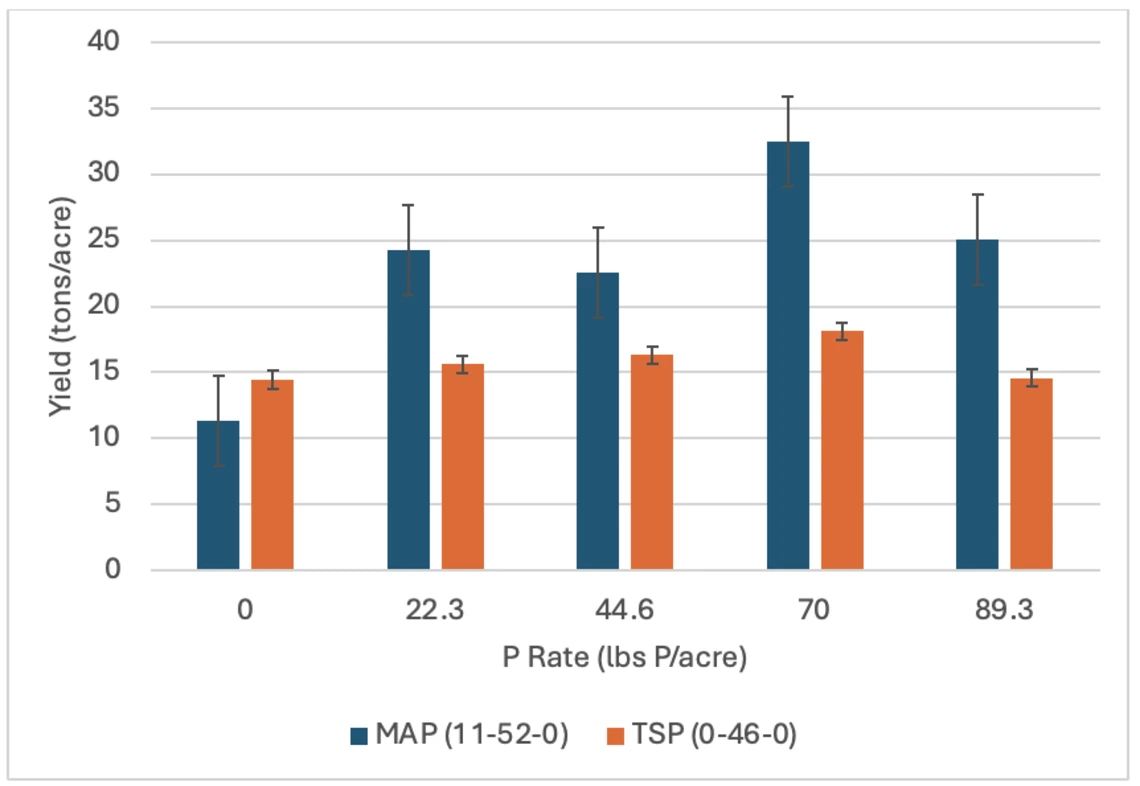
Figure 2-2-6
Response of lettuce to triple superphosphate compared to monoammonium phosphate (MAP) in a field experiment conducted in Maricopa in 2011.
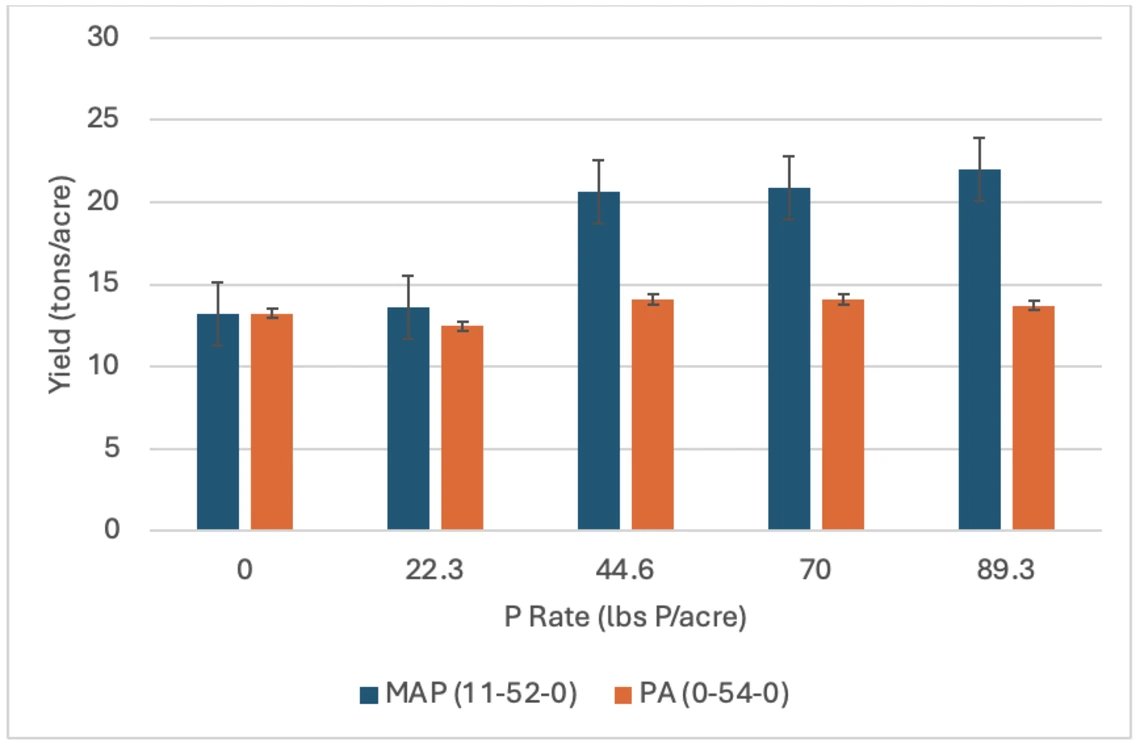
Figure 2-2-7
Response of lettuce to banded monoammonium phosphate (MAP) and banded phosphoric acid (PA) in a field experiment conducted in Yuma during 2008.
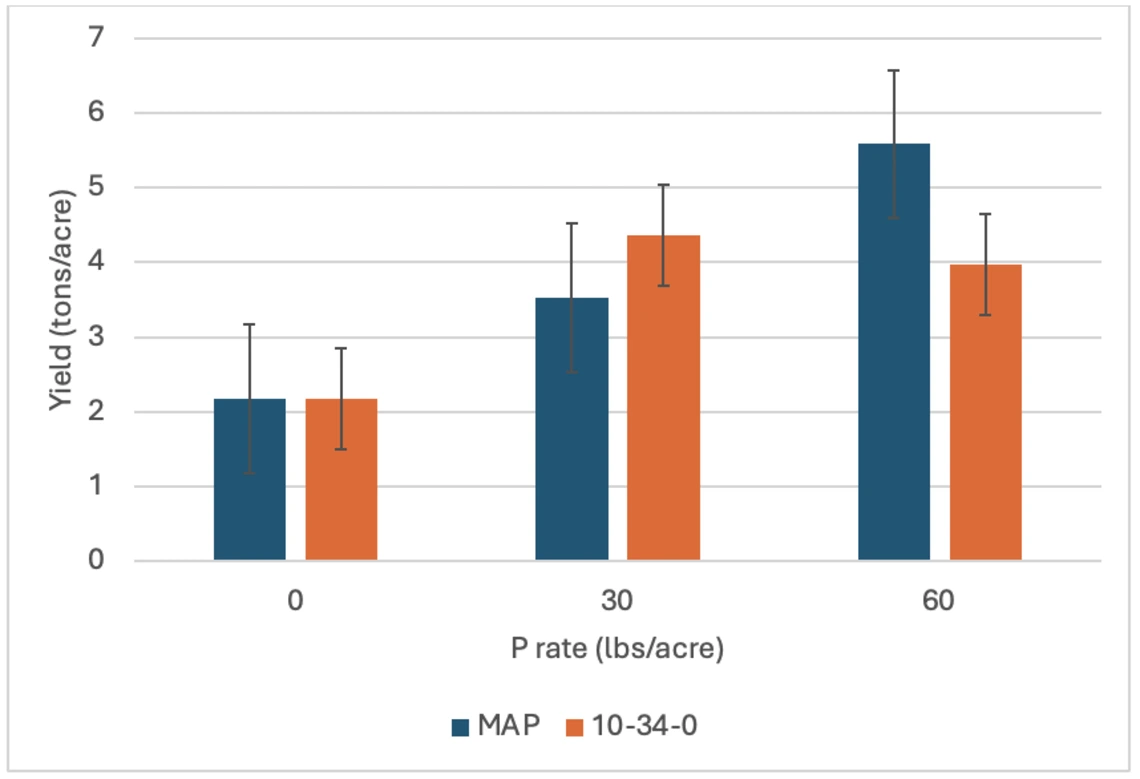
Figure 2-2-8
A comparison of yield response of baby spinach to monoammonium phosphate (MAP) and ammonium polyphosphate power mulched into spinach beds from studies conducted in 2016-2017. The higher rate of 10-34-0 reduced spinach yield.

