
Improve Plant Nutrition
Fertilizer Guidelines for Vegetable Crops in Arizona
Nutrients Required (2)
Potassium (2.3)
Potassium (K) fertilizer is another macronutrient required for satisfactory crop growth and yield, but economic returns are rarely observed in response to K fertilization in the Lower Colorado River Region. Availability of K in soils is typically assessed using an ammonium acetate (AA) extraction test (37). The test is based on the assumption that it is the exchangeable K that constitutes the potential crop available fraction of soil. Because crops in Arizona have generally not responded to K fertilization, we have not had a platform to develop locally calibrated soil test critical levels. The provisional critical soil test levels shown in Table 2-3-1 are compiled from several western sources (38, 39, 40, 41, 42, 43, 44, 45, 46, 47). These reference values should be used for soil test monitoring of K in the event natural soil sources of K become depleted. With a few exceptions, 150 ppm soil test AA K is sufficient for most crops.
A recent survey of pre-plant AA soil test K levels in over 1,000 vegetable production fields found less than 5% of the sites tested had AA K levels below 150 ppm (14). Most soils below this threshold were classified as sandy loams, silty loams, and loams. Despite some soil testing below 150 AA soil test K, crop yield responses to K remain elusive even on these lower testing soils (14, 48, 49). Much of this lack of response is associated with the mixed clay minerology of the soils in the region. While smectites are the dominant mineral in most soils used for vegetable production in the region, all soils contain K bearing mica and negligible amounts K fixing vermiculite (50). Studies conducted with Arizona soils (49, 51, 52) showed potential for substantial release of non-exchangeable K on time frames beneficial during crop growing periods. Thus, a soil test index related solely to soluble and exchangeable K may not accurately account for all potentially labile K sources.
There is also K in most ground and surface waters of the region (Table 2-3-2). For example, Colorado River water typically contains 4.9 mg/L of K, which is equivalent to about 13 lbs of K/acre foot water. Surveys showed that groundwater sources in Central Arizona have K concentrations similar to that of the Colorado River. Although the background irrigation water concentrations of K alone are insufficient to meet crop demands, it nonetheless is a contributing factor to the general lack of crop response to K fertilization in the region.
Another contributing factor is likely the presence of sodium (Na), an ion known to play a substitute role to a degree for K in osmotic adjustment mechanisms in many vegetable crops (53, 54, 55, 56, 57), in soil and irrigation waters. The data in Figure 2-3-1 show celery response to both P and Na soil test levels (58). These data were collected in the eastern United States by the author and is presented here to show the potential for Na to play a substituent role for K in crops with high K requirement. Note that with K consumptions of up to 500 lbs of K/acre at harvest, celery is among crops that have high K requirement. It is important to stress here that the experiments Figure 2-3-1 is based on could not have been conducted in Arizona due to high background levels of both K and Na in the soil and water systems. The Na concentration in the Colorado River water near Yuma is about 100 ppm, or close to 300 lbs of Na/acre foot water.
High Na in irrigation water can have adverse effects on crops and soils. It can be toxic to crops if accumulated in plant tissues at levels that exceed crop tolerance thresholds, but more often, Na has deleterious effects on soil structure (59). Na risk related to soil structure is assessed in terms of an index known as sodium adsorption ratio (SAR) of the irrigation water (SARw), or the soil solution approximated by saturated paste extracts (SARe), and depends on the ratio of the concentration of Na in the solution to those of the divalent cations of calcium (Ca) and magnesium (Mg). The SARw of Colorado River water in Yuma is about 2.7, a level that can be considered too low to produce adverse effects on soil structure. The low SARw of the Colorado River is due to the generally high Ca (about 80 mg/L) and Mg (27 mg/L) concentrations.
By comparison, the ground-waters used for irrigation in Central Arizona showed SARw varied between 2 and 12. The high SARw of some of the irrigation waters is the result of a combination of higher Na and generally lower Ca concentrations. Sound irrigation and salinity management strategies may need to be followed to prevent adverse effects to soils and crops for areas that use the waters with high SARw. However, given that Na can substitute for K to a degree, the presence of Na below problematic levels can be potentially beneficial to crops. Interestingly, for most Arizona soils, soil test AA Na levels are typically within the same order of magnitude as AA K levels. However, Na in soils is typically assessed using saturated paste extracts (SPE). As shown in Table 2-3-3, SPE Na is an order of magnitude greater than SPE K.
Because strict adherence to the provisional K soil test thresholds in Table 2-3-1 would often call for K fertilization when it is not really required, the author recommends K tissue testing as an ancillary tool for monitoring the nutritional status of vegetable production sites in Arizona (Section 4.3).
Table 2-3-1
Provisional soil test ammonium acetate (AA) levels of K for important vegetable crops in Arizona
1This higher value than typically reported in the literature is based on work by Silvertooth (37, 50). In studies in Southeastern Arizona and Southwestern NM, Silvertooth and colleagues found on some soils testing over 150 ppm AA K, K release from the soil did not meet crop K demand (37). On low CEC soils, chile peppers may benefit from higher rates of K or split applicatoion.
2This higher value is based on work by Hartz et al. (51, 52, 53) that found fruit quality was improved by K fertilizer at AA K levels greater than 150 ppm. Although not always economically justified for processing tomato, fruit quality issues do affect marketable yield of fresh market tomato.
| Crop | Ammonium acetate (AA) critical soil test K levels (mg/kg) |
|---|---|
| Bok Choy | 150 |
| Broccoli | 150 |
| Cabbage | 150 |
| Cantaloupe | 150 |
| Carrots | 200 |
| Cauliflower | 150 |
| Celery | 200 |
| Endive | 150 |
| Escarole | 150 |
| Lettuce | 150 |
| Napa | 150 |
| Onions | 100 |
| Peppers (chile) 1 | 200 |
| Potato | 150 |
| Tomato2 | 200 |
| Watermelons | 150 |
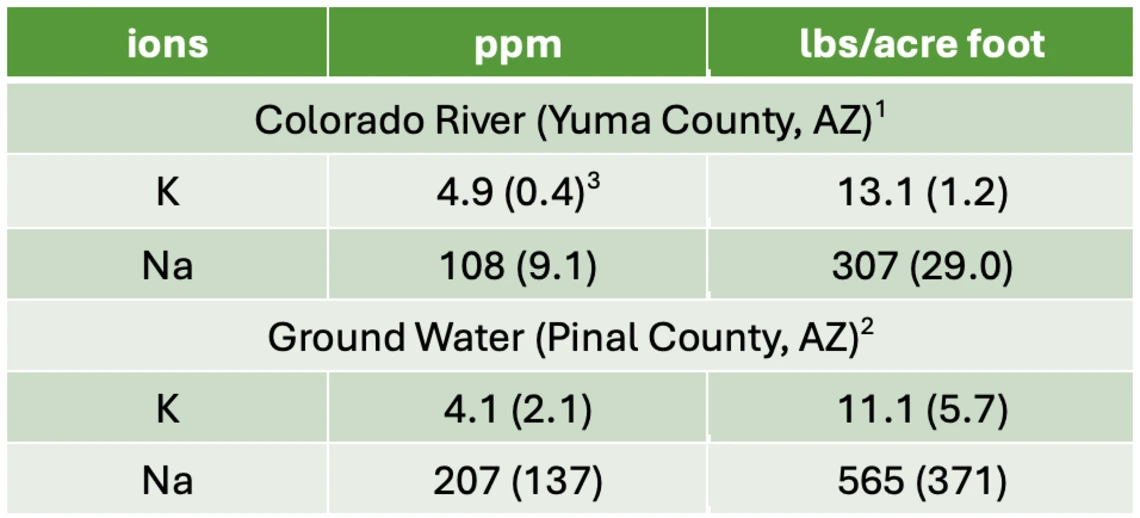
Table 2-3-2
Potassium and sodium concentrations of irrigation water used in Arizona.
1Data is mean of 549 water samples collected over time at Imperial Diversion Dam. Values for water and saturated paste extracts (SPE) are often reported in milliequivalents per liter. The conversion to milliequivalents requires division of values for ppm (mg/L) by equivalent weight. To get meq/L from ppm, divide values in mg/L for K by 39 and Na by 23.
2Data is mean of 40 irrigation wells sampled in Central Arizona.
3Values in parenthesis are standard deviation.
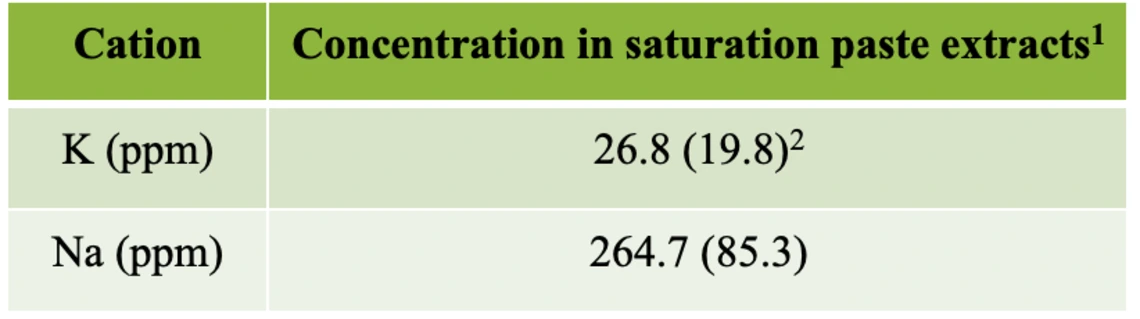
Table 2-3-3
Concentrations of K and Na in saturated paste extracts (SPE) from vegetable production sites in the Yuma region.
1Data from a survey of samples collected from 728 vegetable production sites (14). Values for water and SPE are often reported in milliequivalents per liter. The conversion to milliequivalents requires division of values for ppm (mg/L) by equivalent weight. To get meq/L from ppm divide values in mg/L for K by 39 and Na by 23.
2Data in parenthesis are standard deviation.
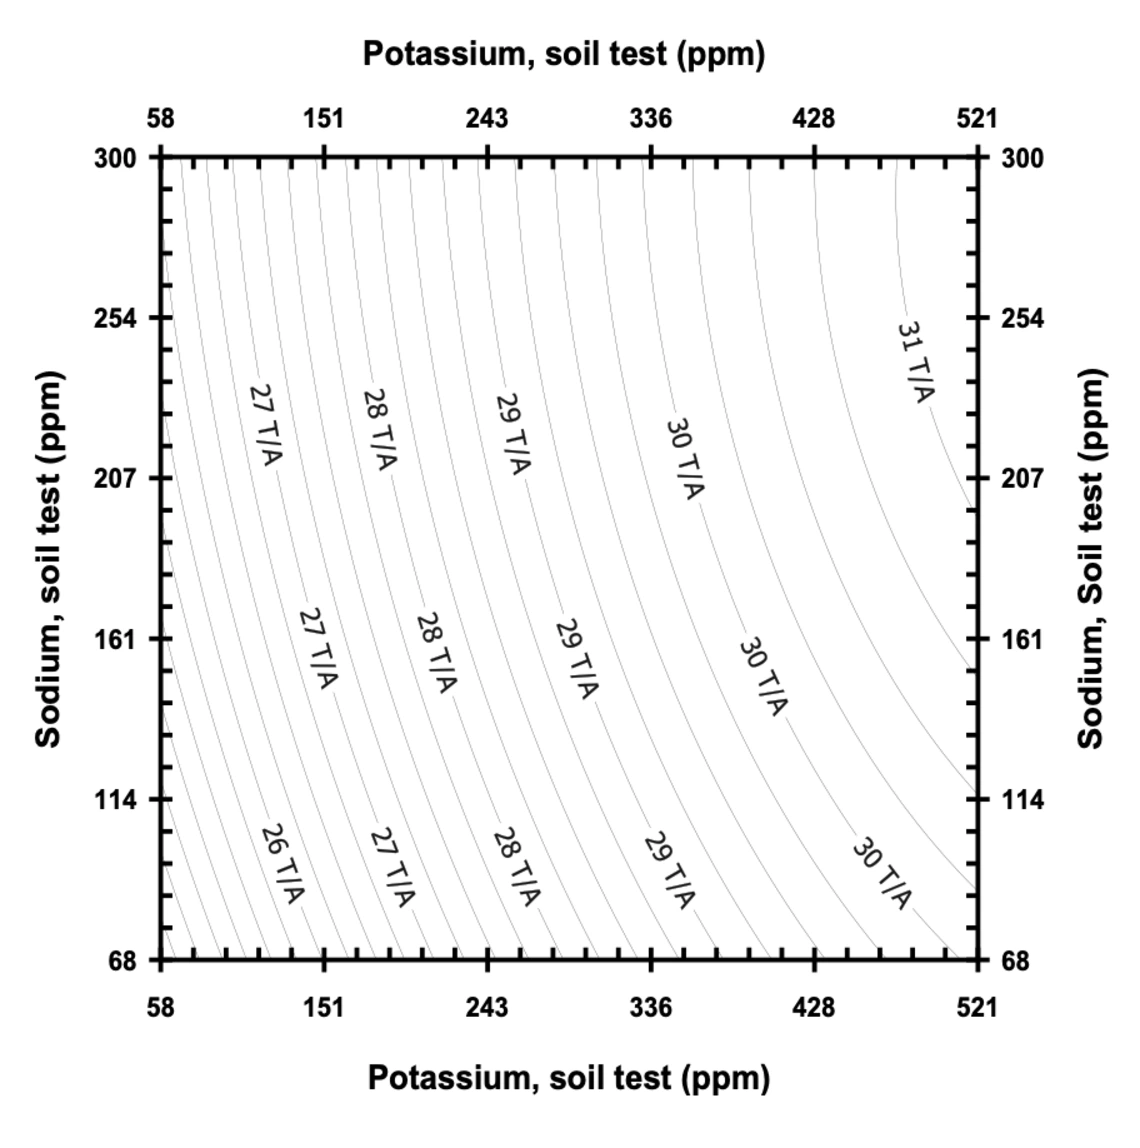
Figure 2-3-1
Crop yield response map as a function of the interactive effects of soil potassium and sodium [Yield is expressed in English ton (T) per acre (A)]