
Improve Plant Nutrition
Fertilizer Guidelines for Vegetable Crops in Arizona
Nutrients Required (2)
Nitrogen (2.1)
Nitrogen (N) is the most limiting nutrient to crop production in the southwestern United States. The Lower Colorado River Region near Yuma is one of the most productive regions for vegetable production during the fall, winter, and spring growing seasons. In order to meet the strict quality standard requirements of the produce supply chain, ample amounts of N fertilizer are applied to these crops. In addition to crop uptake, which represents a beneficial disposition of soil-applied N, N fertilizers applied to crops could be lost through various pathways (1). Urea and ammonium forms of N fertilizers can be lost through ammonia volatilization (2). Nitrate-nitrogen can readily be leached below the crop root-zone following irrigations (3) or can be lost to the atmosphere as molecular nitrogen (N2) and nitrous oxide (N2O) gases (4). Also, inorganic N might be immobilized into the organic soil fraction through the actions of soil microbes, resulting in delayed crop availability (5).
Over the past two decades, University of Arizona and University of California researchers have developed strategies for efficient N management. Recommended practices include pre-fertilization plant and soil testing to determine soil N status, timing of fertilizer applications, and improved irrigation management (1, 6, 7). Management guidelines and practices pertaining to efficient irrigation practices for vegetables in the Lower Colorado River are available elsewhere (8, 9, 10). The following discussion specifically addresses N fertilizer management.
N fertilizers are available in the form of urea or some blend of urea, ammonium (NH4), and nitrate (NO3). Following soil application, each of these forms eventually produce nitrate through the processes of hydrolysis and/or nitrification. As a result, nitrate is typically the most prevalent form of plant-available N in the root zone. Notably, the negatively charged nitrate ion is mobile in the soil due to the net negative charge of soil minerals and can readily be leached below the crop root zone by rainfall and irrigation. Therefore, timing N applications in accordance with crops demand is a good strategy to avoid undesirable N losses (1, 7). Data basis for seasonal crops N accumulation patterns have been compiled by others (7, 11, 12, 13) and are useful for timing N applications.
Vegetable crops require pre-plant application of N fertilizer when the pre-plant soil N levels are less than 10 ppm nitrate-N. Prior to the start of the fall vegetable growing season, most vegetable fields receive a pre-irrigation to restore salt balance (9). Results from a survey of samples collected from vegetable fields prior to planting showed 65% of the samples collected had nitrate-N levels at 10 ppm or less (Figure 2-1-1). In addition to N, phosphorus (P) fertilizer is applied pre-plant. Monoammonium phosphate (MAP or 11-52-0), which contains N, is the primary source of P fertilizer in the region. As a result, the pre-plant N requirement is often met with P fertilization. However, under conditions where pre-plant P requirements are low due to high-soil P levels, pre-plant application of N fertilizer could be required (Table 2-1-1). This N fertilizer might be applied pre-plant broadcast or, alternatively, the early season N requirements might be applied through sprinkler irrigation during germination and stand establishment. For most crops in the area, solid set sprinklers are used for germination and stand establishment (9) then all following irrigations are by furrow.
For furrow-irrigated vegetable crops, in-season N applications are most often made by tractor applied sidedress injections for optimal uniformity of application (Figure 2-1-2). Naturally, there are logistical tradeoffs as to when tillage, irrigations, and crop growth status allow opportunities for tractor-applied sidedress N fertilizer applications. In the past, more than one sidedress application was often used; the goal being minimizing various forms of fertilizer loss and maximizing plant uptake. However, more recently for logistical and economic reasons, growers principally rely on one sidedress application after thinning and during cultivation. There is also a potential for subtle damage to roots later in the season from sidedress operations (14).
In the Yuma area, vegetable crops are typically grown in loam to clay loam textured soils and under efficient irrigation management (8, 9) with minimal late season leaching. For coarse textured soils, a more frequent and lighter application of N would be required for optimal N use fertilization efficiency. This would not be logistically feasible for tractor-applied sidedress in furrow irrigation systems. In these situations, the use of controlled release N fertilizer, or fertigation depending on irrigation infrastructure, should be considered. Discussion of potential applications of controlled release N fertilizers are discussed in Section 4.5. Fertigation is discussed in Section 4.4.
Plant tissue tests were often used to diagnose soil N deficiencies. Doerge et al. (7) complied sampling protocols and critical test values for a range of economically important crops in Arizona, including vegetable crops. The protocol typically involved nitrate extraction of plant petioles, midribs, or stems. Subsequent studies of leaf petiole nitrate tests for cotton (15) and stem nitrate tests for wheat (16) confirmed earlier results. For vegetable crops, soil nitrate tests were found to be more reliable than tissue tests. Tissue nitrate levels are dependent on what part the plant the sample was taken and the plant stage of growth at the time of sampling. Therefore, minor deviations from specified sampling protocol may confound interpretation. Furthermore, there is often diurnal variation in nitrate-N levels in plant tissue associated with changing sunlight and temperature, which impacts metabolic processes of plants such as nitrate reductase. The diagnostic accuracy of tissue tests is found to be sound when sampling protocols are rigorously adhered to. However, the application of plant tissue tests appears to be more diagnostic for vegetable crops, while soil nitrate-N tests can have prognostic applications.
In a series of studies conducted in lettuce, broccoli, and cauliflower fields in the Lower Colorado River Region, sidedress N application in the context of realistic commercial production scenarios was evaluated. Evaluations conducted in grower fields found 50% of the tissue test predictions were either false positives, where N deficiency was predicted but no response to N application was observed, or false negatives, where N deficiency was not diagnosed but response to N application was detected (Figure 2-1-3 and Table 2-1-2). False positives are often due to extraneous environmental factors that are beyond growers’ control, limiting production below potential, and are expected and tolerable to a certain degree. However, false negatives can lead to yield reduction and hence economic consequences. In this study, plant testing resulted in 25% false negatives while soil nitrate-N testing produced less than 5% false negatives. Thus, the in-season N fertilizer recommendations presented in this guideline are based on a soil nitrate-N test. Recommendations can vary by crop and management system and are presented under the crop sections. Researchers at the University of California have had similar success using pre-sidedress nitrate-N tests (17, 18, 19).
The University of California has developed a quick soil testing protocol using test strips as an alternative to laboratory analysis (20, 21). This quick test correlates well with laboratory nitrate-N test results and is a viable alternative when rapid turnaround of results is needed. This protocol for using the quick nitrate test is outlined at (21). Results of a study conducted in Arizona also showed that the quick test compares well with the traditional nitrate-N tests (14).
Sometimes supplemental N may be needed later in the season, when crop size will not allow for tractor applied sidedress operations. This later need for N might result from N leaching due to above-average rainfall, less than ideal irrigation management, or longer irrigation lengths or production on soils coarser in texture than the norm under which this furrow system was optimized. Thus, in-furrow fertigation may be required. This decision should also be based on in-season soil nitrate-N tests.
Data shows no difference was found among the alternative soluble N sources applied through sidedress in terms of their effect on crop yield (Table 2-1-3). These findings agree with previous work in Arizona (22). Hydrolysis (2) and/or nitrification processes in soils (23), both processes that produce NO3 from the commercially available N fertilizers, are slow under cooler temperatures of the vegetable growing season. However, the lower crop growth rates associated with lower temperatures result in correspondingly slower rates for N demand. Furthermore, no difference was found in crop yield between soluble N sources applied through fertigation with furrow or drip systems (14). Urea ammonium nitrate solution (UAN-32) has been successfully used in the context of fertigation with sprinkler systems. Others report benefits from changing to sources with a higher proportion of nitrate-N for sprinkler fertigation during cooler months, and this practice is not discouraged.
The University of California N fertilizer management protocols stress that the contribution of the background N content of irrigation water to the soil N needs to be considered in determining the crop N fertilizer requirement. This recommendation is appropriate in California where many ground water sources used for irrigation have high nitrate-N concentrations. However, almost all vegetable crops produced in the Yuma region use Colorado River water for irrigation, which has low nitrate-N levels, typically less than 0.1 ppm (less than 0.3 lbs N/acre foot water). Thus, the contribution of background N content of the irrigation water to soil N is negligible in the Yuma area. Notably, there are areas of Arizona where ground water sources are used for irrigation. Available data from irrigation wells in Central Arizona (14) show nitrate-N concentrations ranging from 0.2-39.0 mg/L. These data suggest that in areas of Arizona where ground water is used for irrigation, the nitrate-N contribution of irrigation water may need to be considered in the determination of total N input.
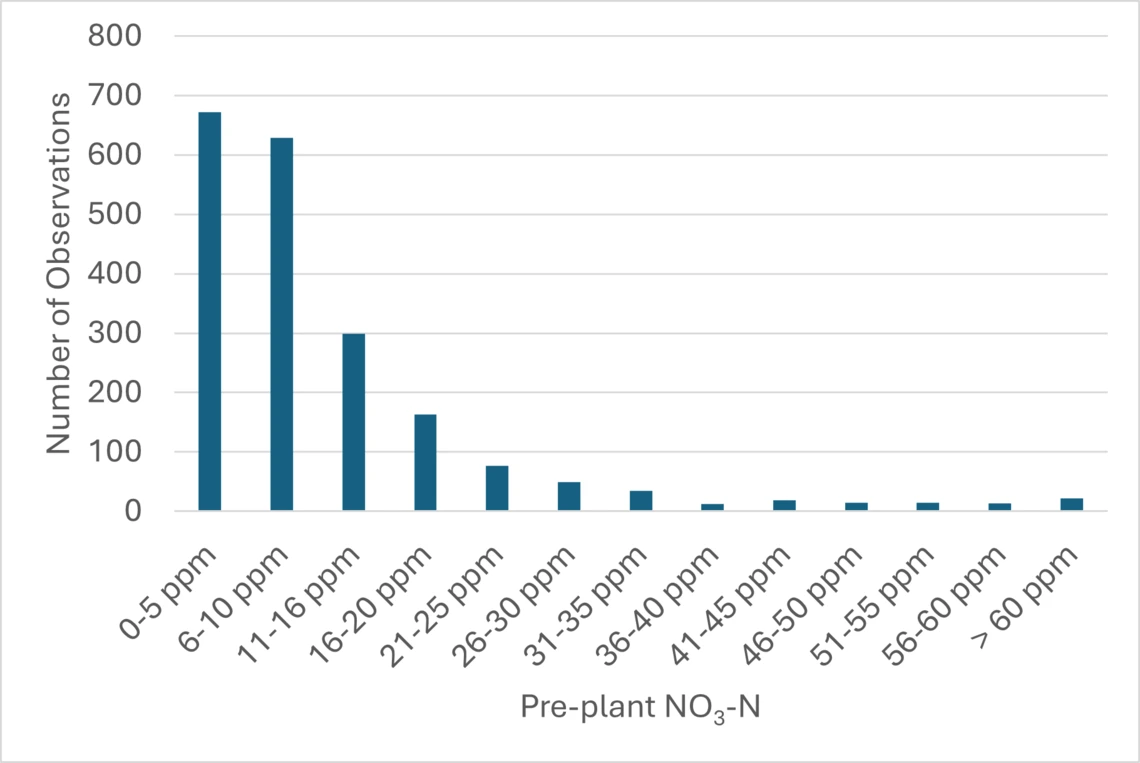
Figure 2-1-1
Pre-plant soil nitrate levels from 2,017 samples collected across the Yuma vegetable production region including the Bard Water District, Yuma County Water Users Association, Yuma Irrigation District, North Gila Irrigation and Drainage District, and the Wellton-Mohawk Irrigation and Drainage District.
Adapted from (14).
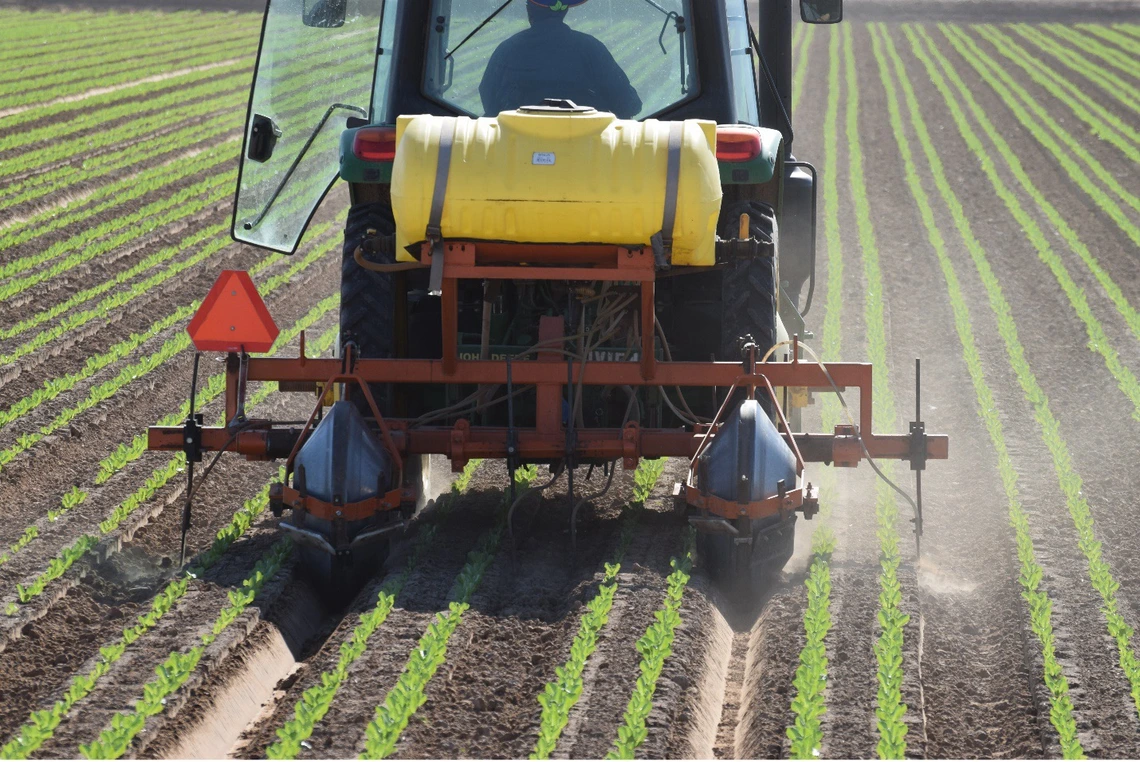
Figure 2-1-2
Sidedress N application for romaine lettuce.
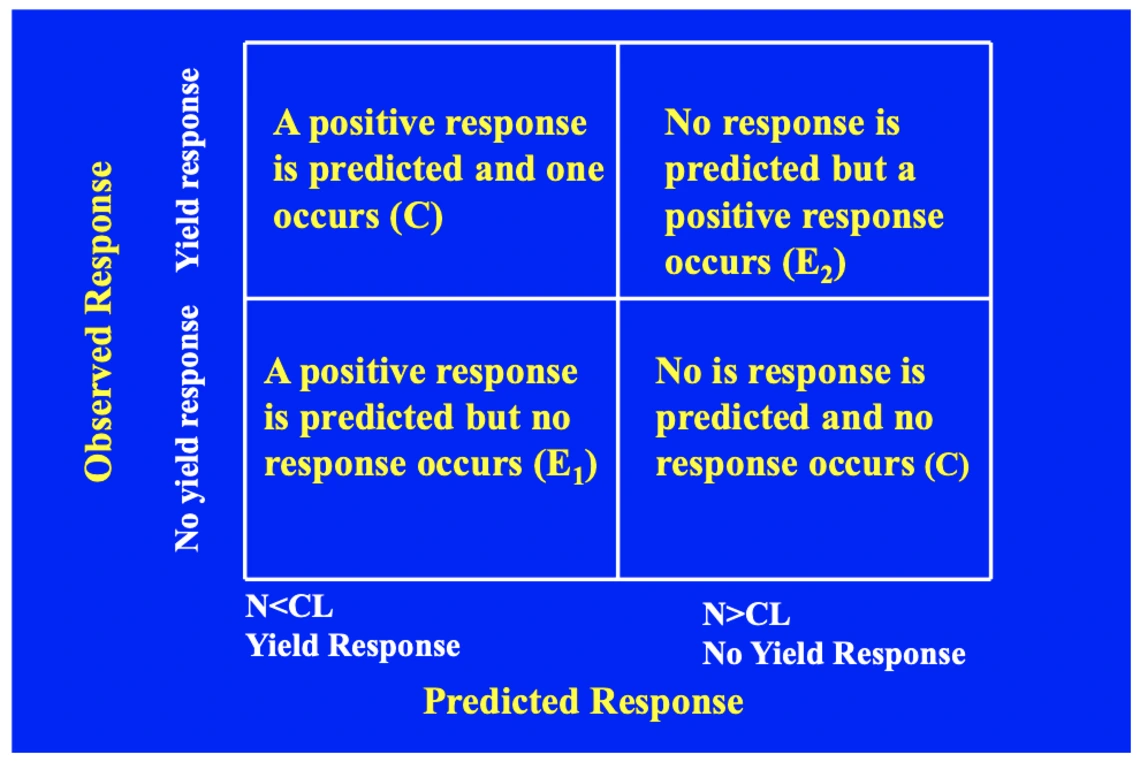
Figure 2-1-3
Potential outcomes for evaluation of tissue and soil test diagnostic tools in sidedress N fertilizer experiments.
CL= critical level of N
N= measured concentration in tissue or soil

Table 2-1-1
Pre-plant N fertilizer required by pre-plant nitrate-N and Monoammonium phosphate (MAP) applied.
MAP is the primary source of phosphorus (P) used for pre-plant P applications.
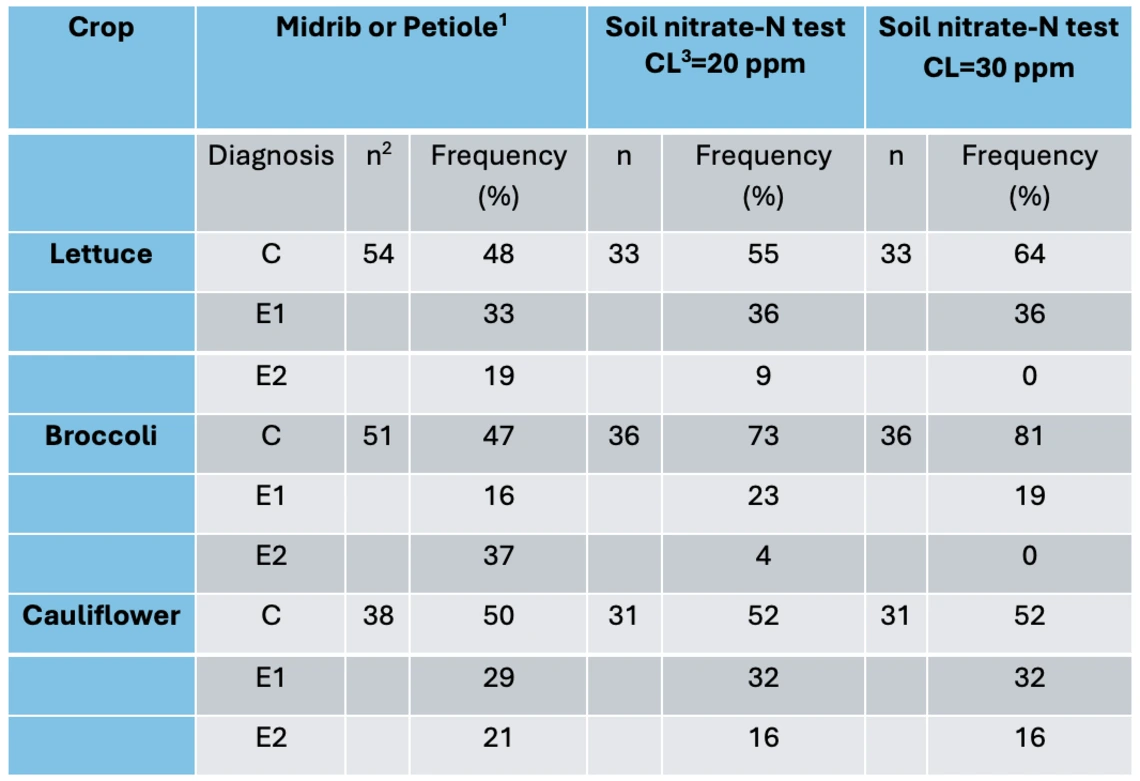
Table 2-1-2
Evaluation of diagnostic accuracy of tissue and soil N testing across multiple sites in the Lower Colorado River Region.
1Midribs for lettuce and petioles for brassica.
2Number of observations. There is more data for tissue testing since we began these studies by assuming tissue tests work well. However, after year one of these evaluations, we included soil testing evaluations as a potentially more reliable prognostic tool.
3Critical level. California uses 20 ppm in their systems. However, in the early season sidedress system, we found 30 ppm worked better. This is not surprising considering over 90% of the N uptake occurs after the first sidedress. This N uptake is generally greater than 80 lbs N/acre, and often no other in-season N application occurs.
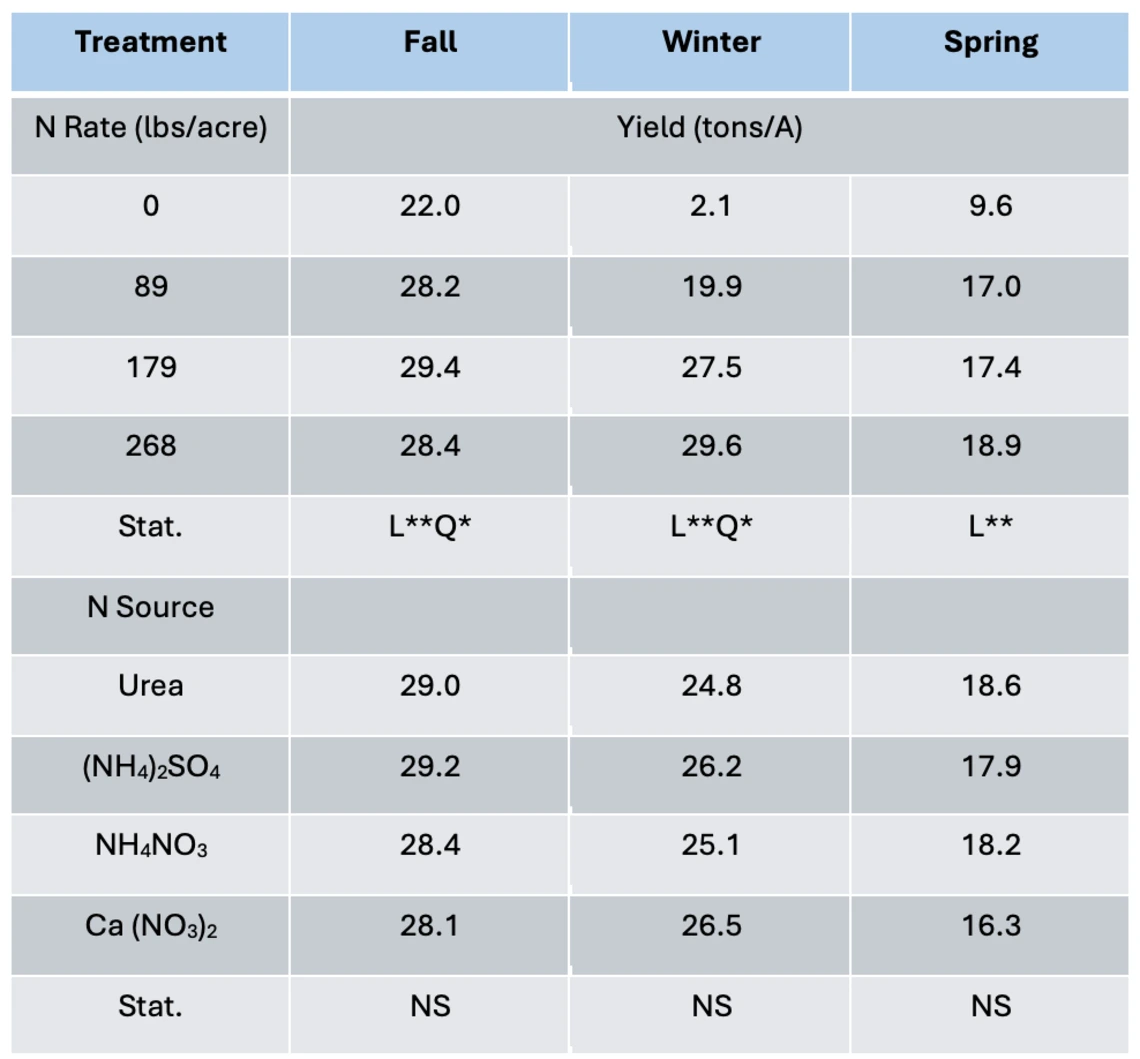
Table 2-1-3
Response of lettuce to N rate and source across seasons1
*,**Significant linear (L) and quadratic (Q) response at the 1% and 5% levels, respectively. Not significant (NS) if p>0.05. Although yields increased by N rate, N source did not affect lettuce yield in any season.
Lettuce wet dates were October 17, 1994, November 4, 1994, and December 18,1994 for fall, winter, and spring season designations.