
Improve Plant Nutrition
Fertilizer Guidelines for Vegetable Crops in Arizona
Nutrients Required (2)
Micronutrients (2.5)
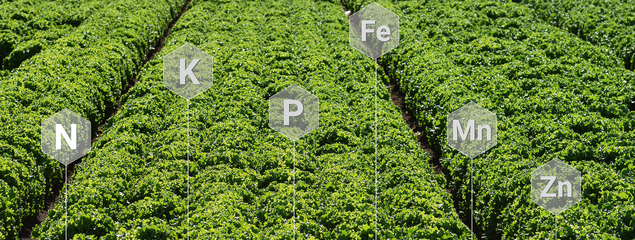
Given that the soils in the Lower Colorado River Region are calcareous, one might anticipate limited availability of many of the metal micronutrients such as iron (Fe), zinc (Zn), manganese (Mn) and Copper (Cu). Remarkably, vegetable crops in the region historically have not shown economic responses to micronutrient fertilization, although crop responses to Zn fertilization are observed in more recent studies (Figure 2-5-1). There are detectable levels of Zn, Mn, Cu, and Fe in the Colorado River at the Imperial Dam Diversion (14), but all these levels are below 0.02 ppm and are too small to contribute to plant nutritional requirements in any substantive way. A more important incidental source of the metal nutrients might be phosphorus (P) fertilizers. Mined P rock has Fe, Zn, Mn, Cu and other metals as impurities and these impurities persist in processed P fertilizer to various degrees (70). Levels of Fe and Zn in phosphate fertilizers are in amounts that potentially contribute to the plant’s nutritional requirements (Table 2-5-1).
Metal micronutrient availability is typically tested using diethylenetriaminepentaacetic acid (DTPA) extraction (71). Generalized guidelines for the western United States are shown in Table 2-5-2. One should not anticipate a response to Zn fertilizer application when DTPA Zn test results exceed 1.5 ppm. A recent survey of soils across the vegetable production area of Yuma shows that about 28% of the fields tested above 1.5 ppm, while 68% tested in the range of 0.5 -1.4 ppm DTPA Zn (Figure 2-5-3). Less than 3% tested <0.5 ppm.
The occasional crop response to Zn fertilization observed in recent experiments were on soils testing in the range of 0.5-1.5 ppm DTPA Zn. The author proposed Zn fertilizer recommendations that vary between 0-20 lbs Zn/acre depending on DTPA soil test Zn levels. We make the same recommendation for all crops based on a DTPA Zn test (Table 2-5-3). These rates are higher than what is needed for a single cropping season but represent the minimum that can be applied uniformly in a blend with other pre-plant fertilizers. Application of these rates usually raise soil test Zn levels such that a single Zn application is good for multiple cropping seasons.
While both soil and foliar applications are often used to correct Zn deficiencies, soil applications are recommended here because foliar application failed to produce consistent crop response (14). Soil applications are typically made by blending zinc sulfate with other pre-plant fertilizers, but the differing granule size and density may reduce homogeneity of the blend and hence reduce uniformity of application. Another option is to apply P fertilizer products where Zn is incorporated into P fertilizer granules. In this product line, two commercial formulations are available: MicroEssentials SZ (12-40-10S-1Zn) and 40-Rock (12-40-6.5S-1Zn). Results of studies summarized in Table 2-5-4 show that 40-Rock is a reliable source of P and Zn under soil conditions where Zn is the limiting nutrient. This fertilizer is a form of monoammonium phosphate (MAP), but with Zn and carrier sulfur added to the granules. There are also technologies where micronutrients are added to granular nitrogen fertilizers. The author, however, does not have experience with these products.
Adding Zn fertilizers with starter fertilizers and insecticides, fertigation with drip irrigation systems, and direct treatment of transplanted seedlings with Zn fertilizer are options for certain production scenarios. The author has had some success with these methods of application. However, further studies are needed before these options can be recommended as alternatives to traditional soil application methods (14).”
The author has not observed vegetable crop responses to any of the other metal micronutrients (Fe, Mn, and Cu) in Arizona. Deficiencies of Fe are commonplace on ornamental plants (72) in Arizona, particularly those of subtropical and tropical origin, but they are not observed in field-grown vegetable crops. Data we have collected from surveys show DTPA Mn levels always test greater than 3 ppm. While DTPA Cu levels sometimes test below 1 ppm, deficiencies of Cu have not been reported. Soil testing for the metal micronutrients should be complemented with tissue testing due to a lack of well-defined critical levels in Arizona. Even for Zn, crops often respond to Zn below 1.5 ppm, but sometimes do not.
The availability of another important micronutrient, boron (B), is often evaluated using hot water extraction method (73), and a value under 0.2 ppm is considered low for vegetable crops. The issue with B in Arizona is the potentially toxic levels in some ground water sources used for irrigation (74, 75). Crop specific tolerances to B can be found at (65). While levels of B in irrigation water from the Colorado River are below levels of concern, some ground water sources are potentially problematic (Table 2-5-5). Deficiencies of molybdenum (Mo) have not been observed in vegetable crops produced in Arizona. It should be noted MAP also contains measured levels of Mo in the range of 15-21 ppm (77).
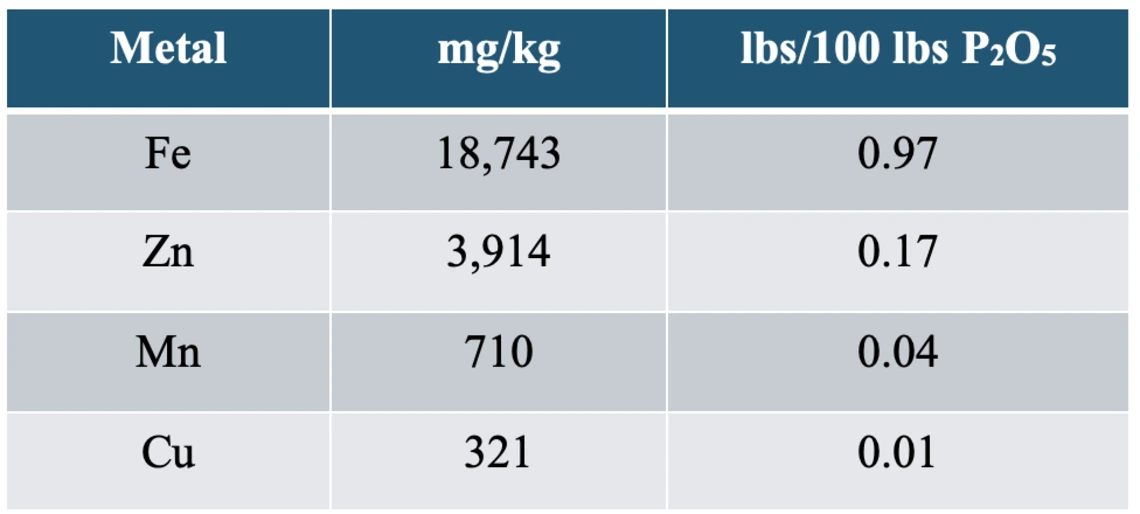
Table 2-5-1
Micronutrient metal content of MAP fertilizer.
Data from a few samples of MAP purchased in Yuma. Actual contents vary by phosphate rock source and over time within source. The number of samples is too small to be an estimate of population mean, but the data is within ranges reported by others (70, 76, 77, 78).
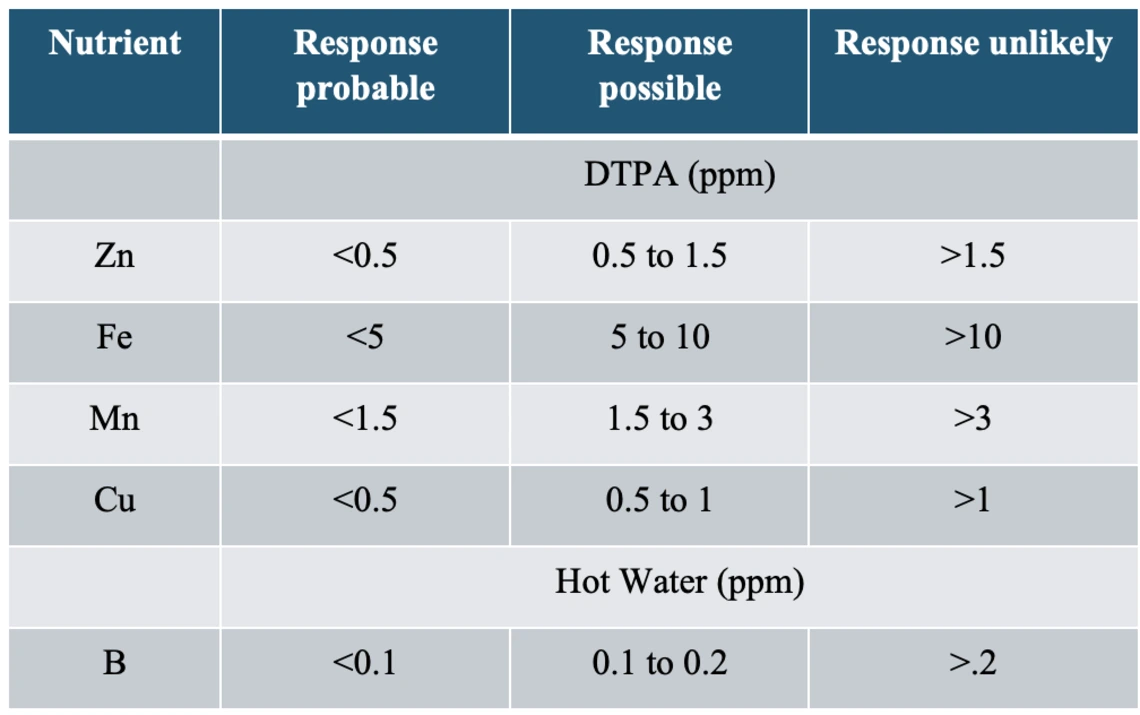
Table 2-5-2
Generalized guidelines for soil test-based micronutrient fertilization in the western United States.
Adopted from 42.
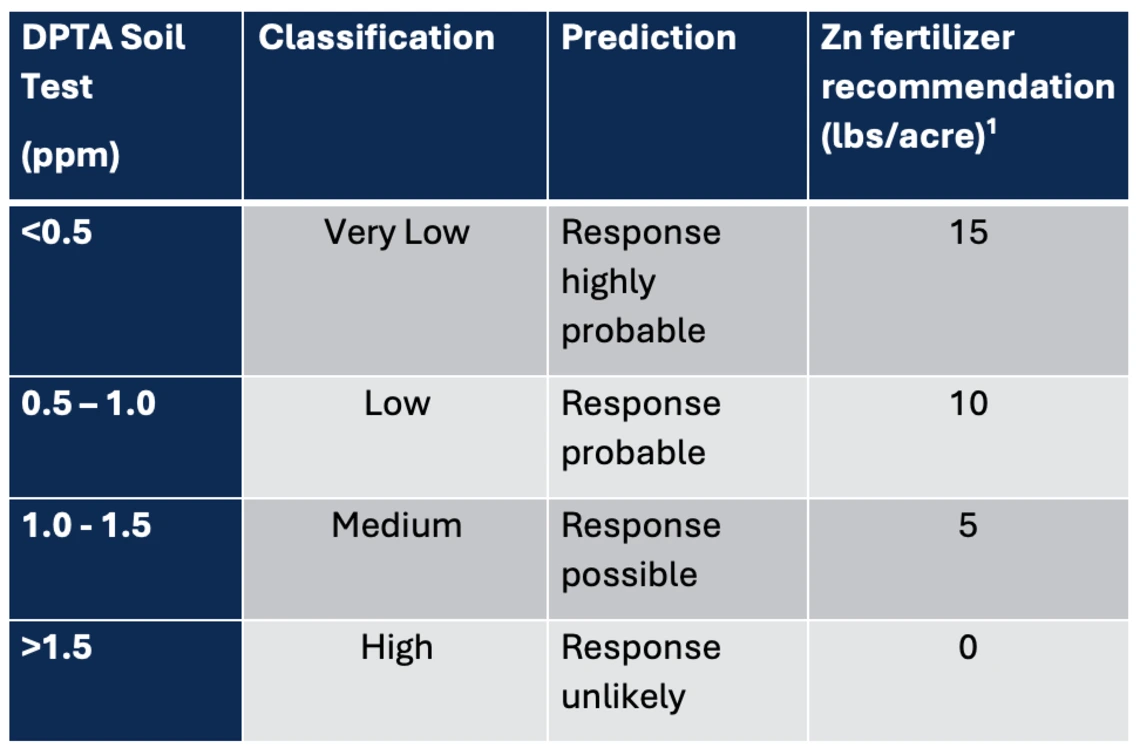
Table 2-5-3
Zn Fertilization Guidelines for Vegetable Cropping Systems in Arizona.
1The rates of 5, 10, and 15 lbs/acre Zn would be 22, 44, and 65 lbs of zinc sulfate, respectively.
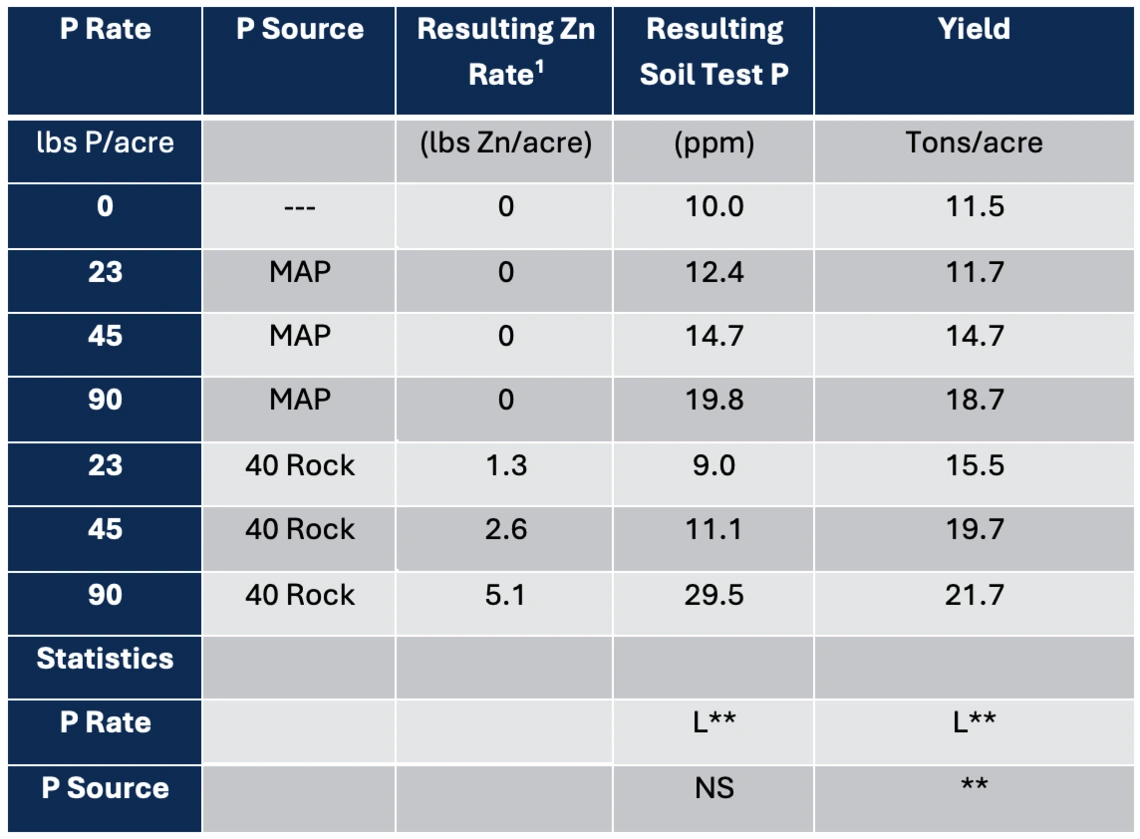
Table 2-5-4
Yield of lettuce to P fertilizer not containing Zn (ordinary 11-52-0) and MAP-P fertilizer with Zn imbedded in the granules (12-40-10S-1Zn). Response to P fertilizer was greater when Zn limitation abated.
1The Zn incidental as a contaminate in P fertilizers is not included.
*,**Significant linear (L) or quadratic (Q) effects at P<0.01 (**) and P<0.05) (*), respectively. NS= not significant P>0.05.
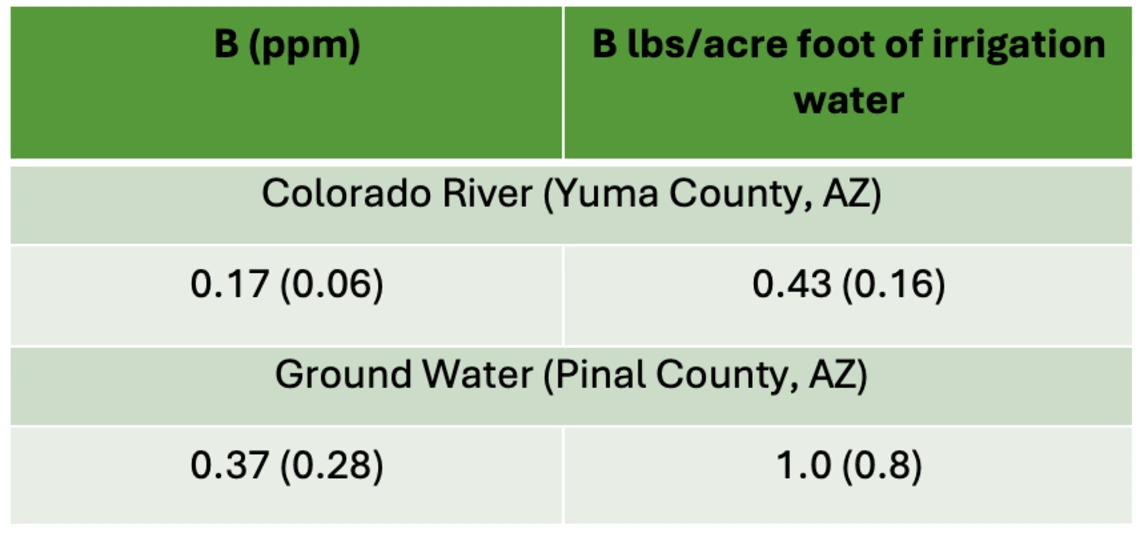
Table 2-5-5
Boron levels in irrigation water in Arizona.
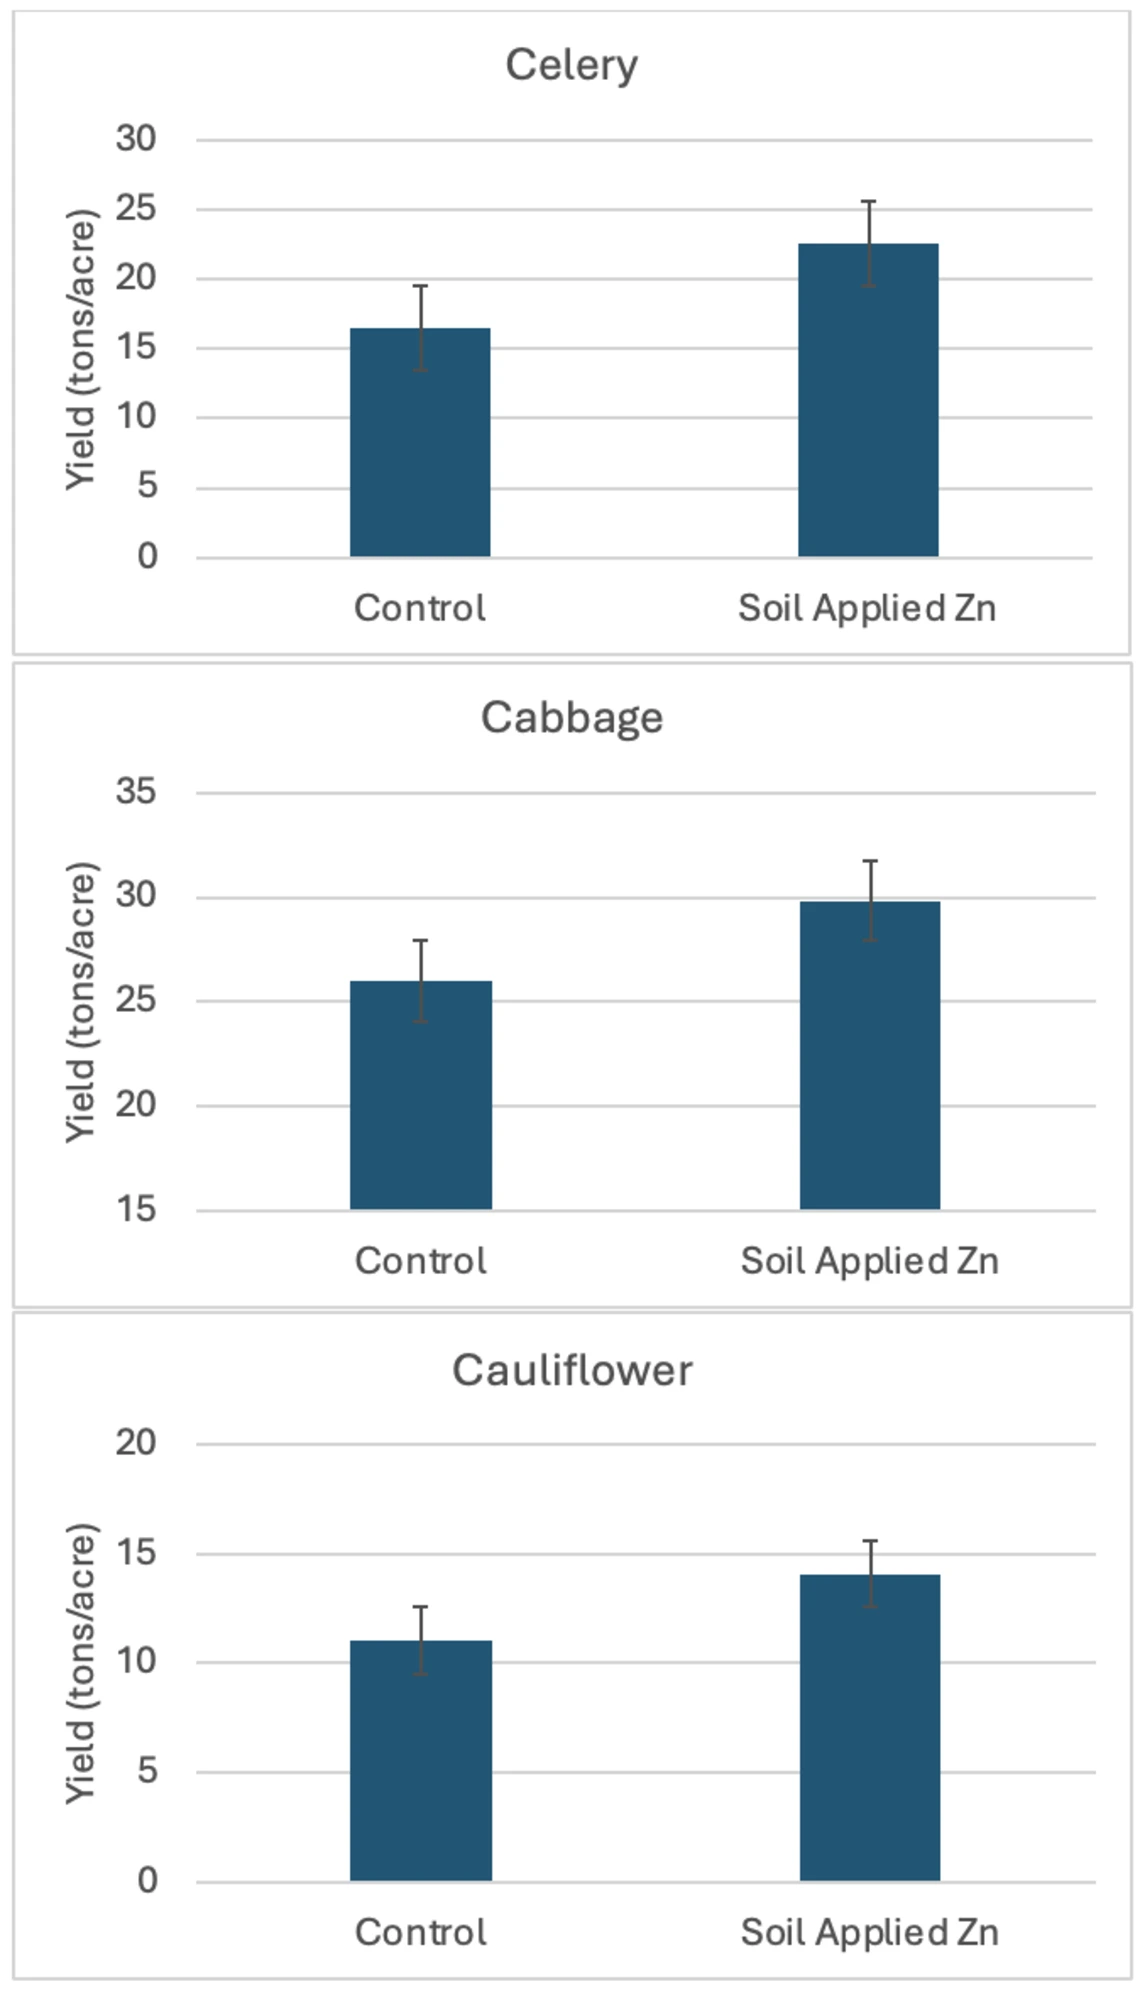
Figure 2-5-1
Response of vegetable crops to soil applied Zn in soils testing less than 1.5 ppm DTPA Zn in the 2019-2020 season.
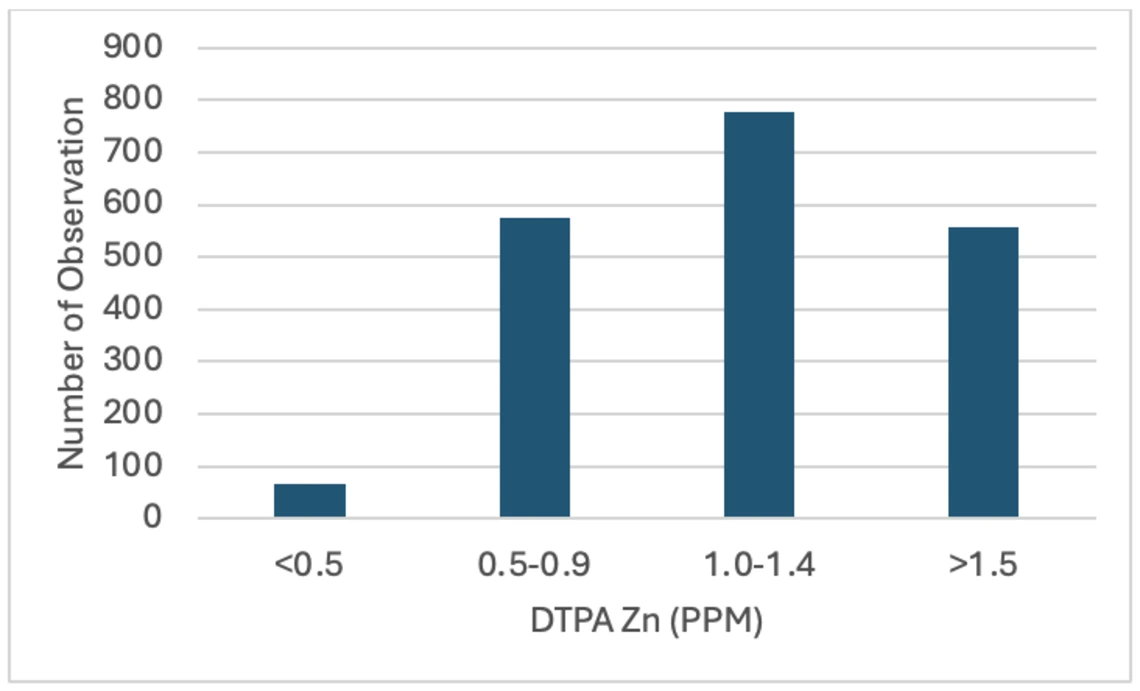
Figure 2-5-2
Frequency of Zn soil test results in a recent survey. The data are from 1977 vegetable fields sampled across the region including the Bard Water District, Yuma County Water Users Association, Yuma Irrigation District, North Gila Irrigation and Drainage District, and the Wellton-Mohawk Irrigation and Drainage District. Adapted from (14).